Lenvima/Lenvatinib with & without Everolimus–New FDA approval

Another new drug for those of us with ‘unresectable and advanced” kidney cancer!  YEA or is is just, yea? What does this mean to the patient in this situation as he struggles to get the best treatment possible?

The approval is for Levatinib in combination with Everolimus (Afinitor) for advanced kidney cancer or unresectable (surgery not possible) kidney cancer in patients who have had previous TKI treatment–Sutent, for example.  This was based on a Phase II trial, so a bit unusual in that regard.  Generally the FDA waits until there is a larger Phase III trial, so this reflects the  need for better second-line treatments.

It is always great to have another tool against kidney cancer, and on top of the recent approval of Nivolumab (Opdivo) and Cabozantinib (Cometryx), but do note that all three are for second line use, after the first line meds have failed.  Current first line drugs include high dose interleukin, Sutent and others.

All the patients in this trial had previously used and quit responding to the first line TKIs, and are compared in three arms

Arm 1)  Lenvatinib alone–52 patients—didn’t make the grade

Arm 2) Everolimus alone–51 patients—standard of care for second line

Arm 3) Lenvatinib & Everolimus in combo–51 patients–the new approval.

Not a very big trial, so harder to make broad judgements!

Everolimus is already approved for second line use, and Lenvatinib alone was NOT approved except in combination with Everolimus.  With that, just ignore Arm 1.  The big news is that the combo improved median Progression Free Survival (PFS) in the combo to 14.6 months vs 5.5 months with Everolimus. The median gives us the POINT in time at which half got “progressed” on their disease, ie, the damn stuff grew, while the other half had not yet had progression.  Not an average, so half of the combo patients had PFS by 14.6 months, and the other combo half did not have PFS until after that time.

The median Overall Response Rate (ORR) was not very high–but quite typical–and important to understand.  The combo patients had a 37% ORR, so about 1 in 3 had a measurable response.  That compared to just 6% with everolimus.  The most important measure to patients is median Overall Survival. This is usually measured when one-half of a patient group has died, so there are always patients who live beyond that median point. The combo OS was 25.5months vs the Evero alone OS of 15.4 months.  There was no mention I could find whether there were patients alive at this point, but assume there were. Love to know if there are very long term survivors in the combo group, and what makes them more likely to have that response!

In the combo, 29% of the patients discontinued treatment due to side effects and with Everolimus alone, 12% discontinued.  However, both groups had large number of reduced dosages and/or dose interruptions, 89% in the combo group, and 54% in the evero group.  Read: some tough side effects.

The most serious side effect in my opinion was that renal failure occurred in 11% of patients in the combo, 5 of the 51 patients.  Grouping ‘renal impairment with failure”, the combo caused such problems in 18% of those patients, 12% i the evero group. Not good news for those of us with one kidney, so something to be monitorly VERY carefully.

The other ‘usual suspects’ in the side effects in the combo were hypertension 42% vs 10%, diarrhea 81% vs 19%.  Not surprising was a fairly high rate of ‘hemorrhagic events”, ie, bleeding problems in both groups, 32% vs 26%. And more.

Again, not easy, better than no treatments,or using everolimus alone.  All these meds demand good communication with the treating team and patients.  Sadly missing in this trial and in every other one is any real guidance as to which patients might best respond to this combo. Neither is there a neat comparison to the second-line use of Nivo or Cabo.  Practice, practice, and be aware of your own health issues as to side effect potential as you look at these trials and your own situation.

http://www.multivu.com/players/English/7690031-eisai-lenvima-fda-2/  for the company’s review and videos by Dr. Sumanta Pal at the City of Hope and a spokemans from Esai.

3 Comments

Filed under Clinical Trials, FDA Meds & Trials, Medications, Patient Resources, Targeted Therapies, Therapies

Immune Therapies: Headlines, Hype or Hope?

Recent headlines called a new medication, Nivolumab, both a miracle or breakthrough and more.  Is it hype or hope?Why is it so hard to sort out the reality?

Let’s go through the facts from the New England Journal of Medicine and ignore the headlines. First, its being  in the NEJM is important, as it has passed review by other researchers.  (Sadly missing in too many ‘breakthroughs”).

The new med, Nivolumab was compared against Everolimus, a second-line treatment. Therefore Evero is thought to be of lesser effectiveness than the first line meds.  Second-line meds are generally used when others meds quit helping or their side effects are too hard. Automatically NOT the miracle cure, but another option when first-line treatments fail.

Should Nivo have been compared to the first-line meds?  Being better in the first-line would be bigger deal, but we need more approved meds. Second-line treatments usually are easier to ‘beat’, as the new med must be better or less toxic.  Again, more likely to be approved!

PATIENT CHARACTERISTICS

The study had 821 patients 24 countries, half using Nivo and half Evero. Patients were similar, 90% having had a nephrectomy, removing the tumor and some or all the kidney. Then the cancer spread, making metastases, (mets, for short). These patients had 1-3 treatments, first-line drugs like Sutent, a targeted therapy, and a few had used cytokines or even chemotherapy.  Having had an mTOR inhibitor like Everolimus was not acceptable. Most had lung mets (67%), followed by liver(12%) and then bone mets (18%). Most with 2 or more sites of mets.

To enter the trial, the patient had to have had disease progression after their last treatment, within six months of enrolling in the trial. No doubt, some patients had greater disease progression than others, but had relatively good performance status, not completely bed-ridden or unable to function.

The median time from initial diagnosis of kidney cancer at any stage to entering the trial was 31 months;  half had been diagnosed less than 31 months ago, and half more than 31 months before the trial. That range of time from diagnosis to trial was 1 to 392 months. That means that for some patients, they went a long time either fighting the disease since diagnosis, having a later recurrence, being treated, yet having disease progression years after the intial diagnosis.  At least one person was diagnosed 392 months earlier. This is a good reminder to patients who have been told, “I got it all”. This darn stuff can return, so having a plan B is important. Again, the previous treatment failed and these patients got directed into this trial.

GENERAL RESULTS

Median Overall Survival (OS) is a measured when one-half of the total number in the group dies. Median OS for Nivo was 25 months with some patients still surviving at time of report, beyond the 25 months. For Evero, OS was 19.6 months, some of who were also likely surviving, as well.  The OS of 25 months was clearly better with the Nivo group by this analysis. Nevertheless, half of all the 821 patients total died while on this trial from progressive disease.  Of  183 of the 410 Nivo patients, 183 has died by 25 months, and 215 of the 411 Evero patients had died at 19.6 months. 


There is no report of ongoing response here, but many went on to other meds, as explained below. 

Median Progression Free Survival (PFS), measurable growth of disease,  was 4.6 months for Nivo, 4.4 months for Evero.  The median shows that half of each group, roughly 200 each had return of disease in less than 5 months!  Again, these trial patients were pretty sick or at risk. All had been treated earlier, and had to stop previous treatments due to recurrence of disease. However, this shows a pretty quick return of disease or new growth from the base CT scan for nearly  65-70% of all patients.

One subgroup did a bit better than the 4 1/2 months median PFS.  At six months after the start of treatment, there was a special subgroup was noted,  about 1/3 of those patients–145 pts (35%) with Nivo, and 129 (31%) with Evero. Obviously they did not die or have Progressive Disease until after six months.  The Nivo group had eventually had a median PFS of 15.6months, and the Evero group, 11.7 months.  Their success pushed the median OS higher, especially for the Nivo group.

Obviously, there were some patients with far more aggressive disease in both groups, some dying before six months, and others not progressing to more disease until after six months.  In contrast, nearly 1/3 of all the patients had PFS of 12-15 months, and much longer OS. What is the common characteristic in the most successful two groups in both arms of treatment?  Not answered by this trial report.

The duration of treatment was longer with Nivo, and likely easier to tolerate. Since Nivo was given by IV every two weeks, the doses were most consistently received. Even so, 51% of them had dose delays, but no per dose reductions.  Those people were seen by the medical team every two weeks.

The Evero group took oral meds, and 66% had dose delays or interruptions with 26% with at least one dose reduction. This would indicate that these meds could be hard to take, or perhaps lacking the same interaction with their medical team.  Of course the Evero patients may have underreported how much of the medication they actually took!

However, the reported types of side effects were generally similar, but the more severe grade 3 and 4s effects in the Evero group.There were 2 treatment related deaths in the Ever group, none in the Nivo group.

POST PROGRESSIVE DISEASE

Even after the disease did progress, about half of  patients in both groups stayed with their meds–despite ‘failing’, the researchers hopes that would continue to benefit, perhaps slowing the disease.  In a local clinic setting or with a less experienced docs, their meds might have been stopped or changed. Afterall, those meds were no longer “working” and  mets are growing. This approach is significant to consider, especially after multiple treatments.  (The decision to keep giving a medication or increasing its dosage where tolerable is causing some changes in treatment in a number of the targeted therapies.)

Perhaps because of being in a trial or getting care than was more expert than most, one-half of  patients chose to keep on the trial meds.  Others crossed over to the med in the other arm or returned to existing non-trial meds. In some countries, there were likely fewer choices than in the US.  There are no real stats as to survival for those on those who stopped taking the meds. It is reported that indicate that 55% of the surviving Nivo group and surviving 63% of the Evero group went on to other agents. About one-quarter of the Nivo group shifted to  the Evero. Of the Nivo group, 36% shifted to axitinib.

Sadly, as per the chart in the New England Journal of Medicine, all these patients had died by 30-33 months post enrollment.  However, it is again not clear what was effect, if any on that period from the non-trial drugs.  Of the 227 who stopped Nivo for any reason, nearly half shifted to Evero. Of those who stopped Evero, 140 went to Axitinib.

DURABLE RESPONSES?  HOW LONG? FOR HOW MANY?

The writers of the study say that there was a higher number of objective responses with Nivo vs Everolimus, and that many (of the Nivo group) “were durable”.  There is no definition of ‘durable’.  My question is “What equals durable?”.  We patients really want a cure, but are very grateful for anything that pushes the cancer back, slows it, stops in from growing any further. Nevertheless, we do want those responses to last.  The clearest reference to durable responses is a note that 32 of the Nivo patients and 6 of the Evero patients had a response that lasted more than 12 months.  But in an unexplained statement, the median duration of treatment was just 5.5 months for the Nivo patients, 3.7 for the Evero group.  It seems that there was not an extension available, or that the patients moved on to a different treatment or passed away.

CONCLUSIONS AND EDITORIALIZING AGAIN

It seems that Nivo is more helpful for some patients than others in this group previously been treated with other TKIs. This is NOT A SILVER BULLET.  There would be greater value to know more about the molecular nature of  the tumors of the responding and the non-responding patients.  We desperately need to know for whom any of these drugs is likely to be more effective.  The headlines that don’t discuss that challenge underserve us, as does the design of the trial that does not elicit the more nuanced, genomic data that could be forthcoming!

We all know that headline claims are more wonderful  than the reality.  The story of RCC medication development is that of more and more help in a difficult disease, making mixed progress, while the other researchers find out that RCC is really many diseases.  Clear cell is probably better defined as being made up of four types, Papillary Type 1 and Type 2 being further divided into three Type 2, then there is chromophobe, clear cell papillary and the really odd versions of RCC.  I known this, and so do you.  But why don’t the researchers incorporate those definitions and monitor the patients with those various subtypes as they go forward?

Good luck to all of us.


1 Comment

Filed under Clinical Trials, genomics, Genomics & Genes, Immune Therapies Old & New, Newly Diagnosed, Patient Activism, Therapies, Uncategorized

We hear of “patient engagement” as a topic, but it can be misused in a self-serving way! For some hospitals, it comes in the form of a survey that asks your opinion of the newly-remodeled lobby, but never asks if you were properly treated while in the hospital.  That is my least favorite and most cynical use of ‘patient engagement’ efforts.

We patients must be engaged, especially needed in this cancer world.  But that is a huge challenge when we have not be taught by experience or the medical world to do so.  Just how does the nervous or bewildered patient do that when the problem is confusing or terrifying?

Starting with what we know about ourselves and knowing HOW to explain it is obvious, but not easy.  Just how to do that?

See what doctors are learning, as in the following short article.  There is a link to a Patient ToolKit  http://www.patient-experience.org/PDFs/Patient_Toolkit_v4A_Fillable-Format.aspx developed by others who work with me to improve diagnosis.  This is available for anyone to use, can be filled in online or printed out as needed.

Simply, it helps the patient organize his symptoms, concerns and history in a way that MIGHT be more acceptable to the doctor.  It can remind you well ahead of the appointment what to do so that the appointment is more useful and efficient.

Your ideas gratefully requested.

http://www.patient-experience.org/Resources/Blogs/DM-Blog/Blogs/July-2015-(1)/Engaging-Patients-Before-You-Even-See-Them-Tools-t.aspx

2 Comments

by | July 30, 2015 · 9:58 am

Genetics of RCC: Paving the Way for the Next Generation of Therapies

This lecture is the most important I have heard this year.  Dr. Brugarolas provides us significant data to explain by RCC cancers behave so differently.  This data will affect how we name our cancers, and how we treat them.  Take this lecture in bits, as it is complex.  You might want to start with a companion interview, entitled “Classifying RCC by Its Biology: Good Looks Won’t Do It Anymore.”

James Brugarolas, MD, PhD.

Kidney Cancer Program Leader Associate Professor of Internal Medicine & Developmental Biology; University of Texas Southwestern Medical Center

http://www.chemotherapyfoundationsymposium.org/mobile/player.php?id=476

“Welcome to everyone and I thank the organizers for their kind invitation. I’m going to talk to you today about the genetics of kidney cancer and how I believe the paving the way for the next generation therapies. (There are no significant disclosures.)
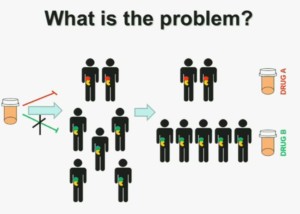
Brug 1 What is the Problem

What is the problem? This is a problem that we are well aware of some nowadays. We’re using one drug for all patients with kidney cancer. You may imagine that these are all patients with metastatic renal cell carcinoma. But it is a heterogeneous population. Some have the red tumor, some of them the green tumor, and the drug may work with a subset of patients, but it may not work for another subset of patients.

The paradigm we should be evolving to is a paradigm where patients with different tumors should be treated with different drugs.
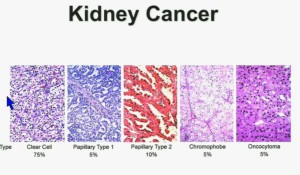
BRUG 2 Kidney Cancer subtypes
In the context of renal neoplasms , as you are well aware, we have kidney cancer with clear-cell carcinoma which accounts for the vast majority (75%) of that, and that’s going to be the focus of the first part of the talk.
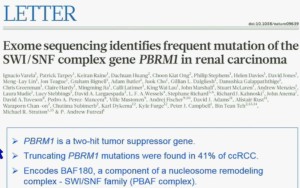
BRUG 2 EDITSCapture
The work from the Sanger Institute by Andy Futeral and Michael Stratton led to the identification of mutations in the polybromo1 gene. Polybromo1, like VHL, the most commonly mutated gene in clear cell renal cell carcinoma, is a two hit tumor suppressor gene. That means both copies are mutated in tumors. They identified through truncating mutation in approximately 41% of clear-cell RCC. PolyBromo1 encodes BAF 180, which is a component of a nucleosome modeling complex which may regulate, among other processes, transcription.
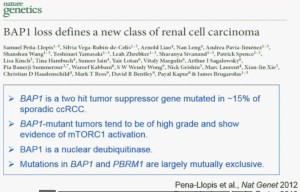
BRUG 3BAP1 loss defiens new class of RCCCapture
Work from my laboratory led to the discovery of another gene mutated in RCC, the BAP1 gene. Like the BPRM1 and VHL, BAP1 is a two-hit tumor suppressor gene, but it is mutated in only about 15% of sporadic clear-cell RCC. This work was done focusing on tumors that were of high grade. Indeed, we found there was a correlation between BAP1 loss and high grade, and also activation of the mTOR1 pathway. BAP1 encodes a nuclear deubiquitinase. Of greatest interest, were mutations in BAP1 and BPMR1, we found, are largely mutually exclusive. This is shown this more detailed the next slide
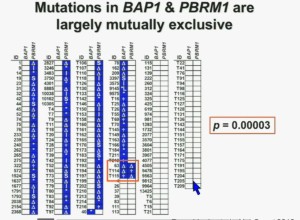
BRUG 4Mutation in BAP1 ^ PBMR1 mut exclu
What you are seeing here are 176 tumors, each in a row. These are tumors that have a deletion in PBMR1, these are tumors with the insertion, this with a point mutation. All the tumors in blue are tumors that have a mutation. As you can see most of the tumors, we see with PBRM1 mutations do not have mutations in BAP1. (in last column) Here you have some tumors with mutations in BAP1, and we only identified three tumors that had mutations in both genes. The probability of having mutations in both was statistically significant. Based on the individual mutation probability, we would have expected 13 tumors to have both genes. Only three were found, suggesting that BAP1 and BPRM1 mutations are largely mutually exclusive.
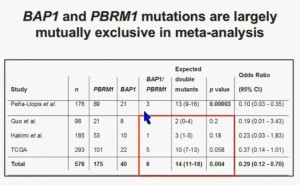
BRUG 5BAP1 & PBRM1 meta anal

We went on to performing a meta-analysis. This is looking at data from that Beijing Genome Institute, at Memorial Sloan-Kettering and this from the TCGA. As you can see, even though the numbers are small, the numbers of tumors with mutations in both BAP1 and PBRM1 was reduced, compared to the expected number of tumors based on the individual mutation frequency, and the p value was statistically significant.
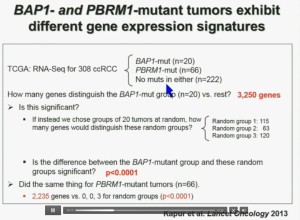
BRUG 6BAP1 & PBRM1 gene signature
I’m going to go through these and not spend much time, but suffice it to say that that we found that these tumors that have had mutations in BAP1 have a characteristic gene expression signature, and the tumors that have mutations in PBRM1 also have a characteristic gene expression signature. These gene expression signatures do not overlap. These are tumors that have different tumor patterns and different biology.
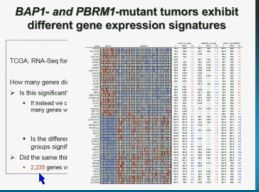
BRUG 7 BAP1 & PBRM1 ex  diff SMALL
We think this establishes a foundation for the first molecular genetic classification clear-cell RCC. In our series 55% have mutations in PBRM1, and 15% of the tumors have BAP1, and 3% have mutations in both.

We also observed that there is a statistically significant correlation between mutations in BAP1 and high grade, and mutations in PBRM1 are low-grade.
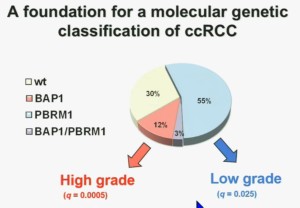
BRUG 8Fdn Mole Gene sign ccRCC

So that led us to propose the following model. This is a model based on the fact that very interestingly, VHL, BAP1, and PBRM1 are all located on chromosome 3. In fact, the short-arm of chromosome 3, and this is an area that is deleted in the majority of patients with von Hippel-Lindau-associated renal cell carcinoma, as well as in the majority of sporadic renal cell carcinoma, depicted here (pie chart) in blue. You can imagine that with a single deletion, the kidney cell is losing, in fact, four copies or one copy of these four different tumor suppressor genes, the BAP1, PBRM1 and VHL.
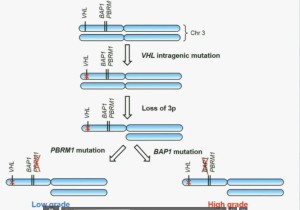
BRUG 10 VHL mutat high low grade diff
We have proposed the following model. We believe that renal cell carcinoma, and this is consistent with Gerlinger and colleagues, that it begins with an intergenic mutation in the VHL gene. And this is followed by loss of 3p, with a concomitant loss of one copy of all of these tumor suppressor genes. We then think that a mutation in PBRM1 leads to the loss of PBRM1 function, which is a two-hit tumor suppressor gene and low-grade tumors, whereas the mutation in BAP1 is associated with the development of high grade tumors.

REFER to ABOVE PIE CHART re High and Low Grades
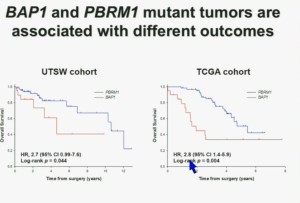
This model also predicts that patients with BAP1 and PBRM1 deficient tumor have different outcomes. So we simply took those patients whose tumors we had analyzed and asked what happens to their outcomes.
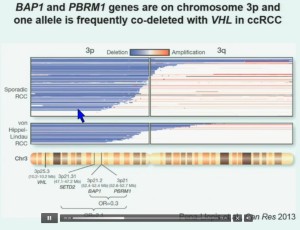
BRUG 9  BAP1 & PBRM1 on chromo 3p VHL

BRUG 12 BAP1 & PBRM1 diff outcomes

As you can see here, we found that patients with PBRM1 deficient tumors had a significant better Overall Survival than those who had BAP1 in their tumors, which had a Hazard Ratio for that of 2.7.

We did a similar analysis with the TCGA cohort, and we found essentially the same result in the same hazard ratio of 2.8, indicating that BAP1 mutant tumors are associated with worse outcomes. This data has now been reproduced by Hakimi and James Ying at Memorial Sloan Kettering, as well as the TCGA with their own analysis and our colleagues in Japan and Tim Eisen.
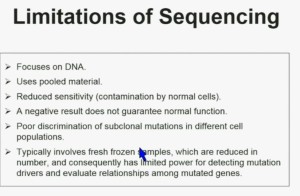
BRUG 12 Limit of Sequencing
There are some limitations of sequencing. We all like next generation sequencing, but it has some limitations. First, it focuses on DNA. Second it uses pooled material. Thirdly, it has reduced sensitivity which is a consequence of contamination by normal cells. In addition, a negative result does not guarantee that it is normal function. There is poor discrimination of subclonal mutations in different cell populations, and as a consequence of using poor material, we cannot tell whether these mutations are found in the same cells or different cells. Typically, it involves fresh frozen samples which are reduced in numbers, and consequently has limited power for doing some analysis.
Interestingly enough, immunohistochemistry (IHC), which we’ve use for a long time is a lot more precise. This is because actually you get information at the cellular level, and you get information about the protein. I mentioned to you that BAP1 is a two-hit tumor suppressor gene, which basically means when it gets mutated, you lose both copies.BRUG 14 dev of BAP1 IHC test
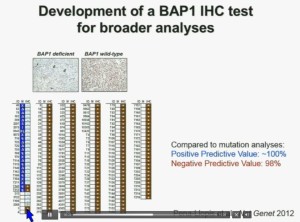
As you can see here–this is the same series showed before. These are here in blue the tumors that had mutations, in the second column, you can see blue and brown, the results by immunohistochemistry. That is done by IHC. And BPA1 is a nuclear protein, as you can see in these beautiful nuclear staining.

The bottom line is the majority of tumors that had mutations had lost BAP1. There were two tumors with point mutations where we were able to detect the protein. But there were three additional tumors we could not detect protein, but where there was no protein. If there is no protein, there cannot be functioning.

With the rest of the tumors, with one exception, were all positive. So compared to mutation analysis, in fact, there is positive predictive value is better and the negative predictive value is pretty similar.
Brug 14
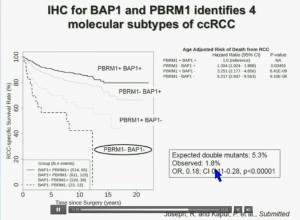
We have used this immunohistochemisty test in conjunction with the Mayo Clinic, looking at their registry with over 1300 with localized ccRCC. As you can see, looking here with people with specific RCC survival, patients with RCC tumors that have BAP1 positive tumors have significantly better survival outcomes than those who have BAP1 negative tumors, again with a Hazard Ratio of approximately 3.
BRUG 16Evalu of PBRM1 by IHC cohort
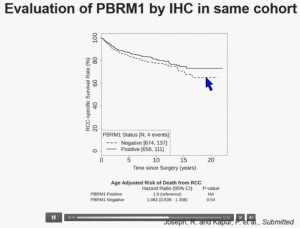
Now in the same cohort we looked at BPRM1, which like BAP1 in a two-hit tumor suppressor gene, and we find no significant differences.
(The following slide in presented in two parts for ease of following the lecture.)
Importantly, this test allows us to identify tumors that are simultaneously mutated for BAP1 and PBRM1. This is important.
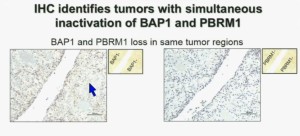
BRUG 17a IHC ids tumors Upper

Upper half of slide. These images of pathology slides

I am going to show you look at this tumor over here (upper left path slide) you can see that the tumor cells, there are some that have brown nuclei, but these are the endothelial and the stromal cells (along the edge of the white). The tumor cells are negative for BAP1.
This is the immunohistochemistry (upper right path slide) for PBRM1, where we find the same thing, the tumor cells are negative for PBRM1.

Lower half of slideBRUG 17b IHC PathSLIDE

Now (below left path slide) compare these tumors with these below. You can see here that the tumor cells positive for BAP1 in this area (the upper right portion of the path slide indicated) and they are negative (in the lower left of the lower left path slide.), where you can see specific nuclei which look blue over there.

Now if you look at the parallel section (Lower right path slide) you can see the area that was BAP1 positive (left hand side) is actually also PBRM1 negative, and the area which was BAP1 negative is actually PBRM2 positive. So what you have over here (in the upper slides as above) is a tumor which has lost BAP1 and PBRM1 in the same tumor region, the same cells. The tumor has lost BAP1 and PBRM1 in independent regions. Obviously these tumors will be acting differently and the tumor we are most interested in is this tumor type (in the upper left image).
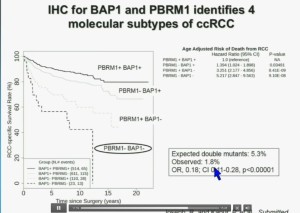
BRUG 18 IHC BAP1 & PBRM1 ids 4 sutypes ccRCC
You have seen in our immunohistochemistry test, and we believe we can separate clear cell renal cell carcinoma into four different molecular subtypes. This is looking at Mayo registries where the patients with best outcomes are those whose tumors are well-typed for PBRM1 and BAP1. Then you have patients that have tumors which are deficient for for PBRM1, patients that have tumors that are deficient for BAP1, and patients whose tumors are deficient for both. As you can see the Hazard Ratio is 1.3, 3.2 and 5.2, respectively. As I mentioned to you at the outset, that these tumors are under represented and indeed in this very large cohort, we found a very large significant under representation with 1.8% of the tumors being double mutant, compared to 5.3% (which would been expected) with a very highly significant p value, again indicating there is mutual exclusivity–for reasons we do not yet understand.
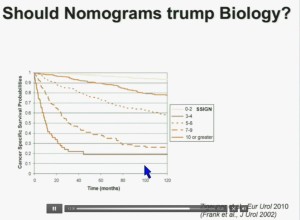
BRUG 19 Nomogr vs Biology
Importantly BAP1 and PBMR1 do not predict outcomes independently of SSIGN, which is the nomogram created by the Mayo Clinic, which is based on Stage, SIze, Grade, and Necrosis. This is the SSIGN nomogram; this is the independent validation. You can see the curves separate beautifully, depending upon the score.

BRUG 20 Nomo vs Bio ANIMACapture
Now another question I submit to you. Should nomograms trump biology? In other words, if they live the same, “What do I care?” That has been the traditionally the thinking in the clinic. But look at these animals. A bullfrog and a grizzly bear also live about 30 years. However, they’re very different. The same is true for cottonmouth, a beaver or hummingbird or a newt. So even though they live the same, they are actually quite different!

We should be probing deeper and in fact, they should be dealt with differently!
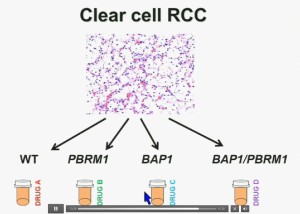
BRUG 21ccRCC per genes
I believe that clear-cell renal cell carcinomas are in fact divided for at least four different subtypes. There are tumors that are both wild type for both BAP1 and PBRM1, tumors that are PBRM1 deficient, tumors that are BAP1 deficient, and tumors that are deficient for both. In the future were going to see different treatments for different tumor types.
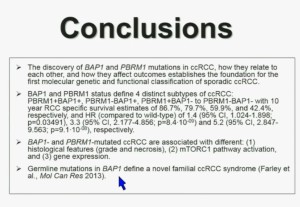
BRUG 22 Conclusions

These two genes define for distinct subtypes, which I just went over and you have the Hazard Ratios and p-values. These two tumors are not only associated with different outcomes, but they are also associated with different activations on the mTOR1 pathway and gene expression. Finally we identify mutations in BAP1 which define a novel clear-cell renal cell carcinoma syndrom e. I have forty seconds left!
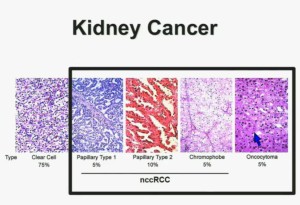
BRUG 23 nnRCC graphic

I will go through these very quickly. Suffice it to say, we have done molecular genetic analysis in non-clear-cell renal cell carcinoma, papillary, chromophobe, oncocytomas, This is now in press in Nature Genetics.
We found that papillary clear-cell carcinoma have more mutations than clear cell carcinoma, whereas chromophobe and oncocytomas have significantly lower mutation burdens, which is depicted there.
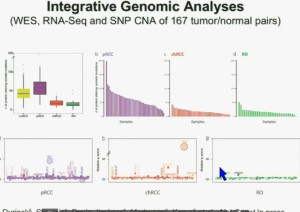
BRUG 24 Intr gen analy subtype RCC

These are some genes we found overrepresented– five seconds! You can see the copy number alterations, gene expressions. Anyway, these papers will be coming out next week.
BRUG 25 Associates

Finally, to acknowledge people who did the work in my laboratory, Pena-Llopis. We have had a close collaboration with the people at Mayo Clinic, and also the group at Genentech, and we work very closely with our surgeon and Payal Kapur, our pathologist.”

3 Comments

Filed under Uncategorized

Classifying Kidney Cancer by Its Biology; Good Looks Won’t Do It Anymore

Looks don’t matter in kidney cancer as much as they used to, as more information comes to us about the molecular or biological nature of the diseases which fall under the “kidney cancer” umbrella.  Can those important biological differences be seen in the pathology laboratory? Must we rely on next generation sequencing to determine which of the subtypes we might have?

Recent work by Dr. James Brugarolas and colleagues is reassuring.  Even as they found  new subtypes of clear cell renal cell carcinoma, they have also determined that these differences can be seen the pathology lab.

Why is this important?  So-called similar tumors may behave in quite different and more aggressive ways, so this is vital to understand the threat of recurrence from a very small tumor.  The affects monitoring and eventually will be helpful in drug selection.

An interview at the 13th International Kidney Cancer Symposium   October 2014

https://www.youtube.com/watch?v=tCoLwClv0tw

Cut and paste the above youtube address into your browser to be able to hear the lecture, while following along below.  The questions are in bold face.

Dr. James Brugarolas Discusses Biologically Classifying Kidney Cancer

“What we have learned with the development of next generation sequencing (NGS) is that no two tumors are the same. Every tumor has different mutations. Mutations are the drivers of tumor biology. With the advances of next generation sequencing, we have been able to identify and group different subtypes of kidney cancer, according to their mutation status.

Specifically, my laboratory discovered that the BAP1 gene is inactivated in 15% of clear-cell renal cell carcinomas. We found that BAP1 mutations are associated with high nuclear grade. That let us to hypothesize that patients who had BAP1 deficient tumors are going to have more aggressive tumors.

Furthermore, we found that mutations in BAP1 tended to anti-correlate with mutations in the second gene discovered by the Sanger Institute, by Michael Estrada and Andrew Futreal, the polybromo1 gene, PBRM1.

That led us to a classification that about 50% of the patients with clear-cell renal cell carcinoma will have PBRM1 deficient tumors and 15% of patients will have BAP1 deficient tumors. A small percentage of patients will have tumors that are deficient for both genes.

In a very productive collaboration we have had with Mayo Clinic, with Rick Joseph and Alex Parker, we’ve been able to determine that these different subtypes are associated with very different outcomes in patients. Patients that have tumors which are competent (not deficient) for both BAP1 and PBRM1 have excellent survival, whereas the cancer specific survival (CSS) is very poor in patients that have tumors that are deficient for both BAP1 and PBRM1. BAP1 deficient tumors have a somewhat intermediate survival phenotype, and the PBRM1 deficient tumors are similar to tumors that are competent for both BAP1 and PBRM1.

So we think for the first time, we’ve able to identify subtypes of clear-cell renal cell carcinoma that are likely to inform therapy in the future.

There is a gap between the discovery of the gene, to the determination of the clinical implications and subsequently to the therapeutic developments. That is because the therapeutic developments are going to emerge from the biologic understanding which we don’t have yet.

   How can improved classification of kidney cancer subtypes improve clinical trial design?

 That’s actually a very good question. So, what has traditionally happened is that a trial may be performed and one may find a group of patients–sometimes small, sometimes larger–that appear to do well with that agent. But if the group of patients is small, the trial is considered to be negative and the drug is abandoned. And I would say the problem is not that the drug did not have activity, it is that we were not able to identify the group of patients who appeared to benefit from that agent.

So the classification that we have developed and the identification of these different subtypes will pave the way to be able to do correlations. So then, when a clinical trial is executed when it is able to characterize better those subsets of patients that may benefit from the agent. For instance, as I was alluding to before, the BAP1 gene is inactivated in 15% of the tumors. It is possible that one of the drugs which has been tried in kidney cancer could have activity against that tumor. But there could never be a trial in that is positive that is being active in a small percentage of the patients, in 15% of the patients.

By identifying meaningful biological subtypes, we hope to deconvolute kidney cancer. It probably makes sense in trials going forward to do prespecified analysis of these genes that we now define as different biological subtypes–to be able to get at the question whether a particular treatment is having greater affect in one biological subtype versus the other. It is possible that it may not be that not all the PBRM1 deficient tumors that benefit, that are inhibited by a particular agent, there are other mutations. But it’s the beginning that which will lead us to identify those biomarkers and patients who are most resistant to a particular treatment.

 What is the significance of improved disease classification for kidney cancer patients?

 That is also an excellent question. These are discoveries that we and others have made over the last two or three years. The implications clinically have begun to be unraveled. It’s going to take significant effort and investment in research for us to go forward. We need to understand how loss of these genes, how mutations in BAP1 and PBRM1, are affecting processes inside the cancer cell, leading to kidney cancer development.

And in particular, we need to understand how BAP1, which is associated with most aggressive type of kidney cancer, is inducing that process. How is it that loss of the BAP1 gene makes the tumor be so aggressive? It’s only once we are able to elucidate the signaling pathways, that we will be able to identify targets for therapeutic invention.

On the other hand, we already know that for patients with localized disease, their prognosis is influenced biology of the tumor. I was alluding to this before, those patients who have removal of a tumor, localized to the kidney who deficient for BAP1 and PBRM1, they have a very high likelihood of recurrence in a short period of time. Those patients whose tumors are wild type for PBRM1 and BAP1 can do very well. (Wild type here means that the two genes are competent, or not deficient.)

Importantly, from the important view of translating these findings to the clinic, we have been able to develop assays, immunohistochemistry assays which are routinely performed in tumor samples at most institutions. (This is done in pathology labs).That allows us to very quickly determine whether we are dealing with the wild type tumor, BAP1 tumor, PBRM1 deficient tumor, or one that is deficient for both.

(Transcribed from the above YouTube video by Peggy Zuckerman. Any mistakes are mine alone, but hope this is helpful in understanding this approach to using gene sequencing in kidney cancer.

May 16, 2015)


1 Comment

Filed under Genomics & Genes, Lectures from Experts, Medical Conferences, Rarer RCC Cancers, RCC Basics

Clear Cell RCC: Not as Clear as It Used to Be!

We struggle to understand what to do about our kidney cancer, but first must  exactly WHICH kidney cancer we have. Frankly, even the doctors are never too sure, and outcomes for patients with the “same” cancer varied widely.  No ready explanation was available, in those bad old days.

Treatment decisions were easy, but not effective for most, when every kidney cancer patient was treated the same.  Patients had surgery and were sent home. Those with smaller tumors, under about 2 inches, had little or no follow up.  Those with larger tumors might be monitored more frequently. Mets might emerge, and maybe more surgery would follow, but no meds were available until 1992 when high dose interleukin was approved.

Patients who presented with metastatic disease were not even offered surgery, being told that there no value to removing the primary!  An ongoing “controversy” was whether there was value in a nephrectomy when mets were found.  Too bad, so sad. (If your doctor is telling you that last bit, you need a new doctor. Now.)

Then came the recognition that there were different kidney cancers, variants and subtypes, all based on the look under the microscope.  Conventional kidney cancer became known at clear cell, and a mix of new subtypes were named.  We now hear of clear cell, papillary type I and type II, chromophobe and more.  Sarcomatoid RCC can arise from any of these types, confusing things and reflecting a more aggressive course for the patient.  Most are sporadic, out of the blue, but others have an inherited component.  Again, making things trickier yet!

Ironically, the trials in the late 80s of high dose interleukin which led to the first FDA-approved treatment, included all the above types. The relatively low response rate in this trial may have been due to the rarer RCC types, unlikely to respond.  This minimized the use of HD IL2, perhaps to the detriment of many patients. The targeted therapy studies often excluded the rarer types, hoping to boost response in a more limited group.  Few trials really test agents appropriate for the non-clear cell types, so the guessing game for them is really the norm.

With that background, there was still wide variation in the outcomes for clear cell RCC patients.  Some patients with small tumors, found at an early stage, can have very poor response to treatment.  Many such patients have long-term survival, easily over 10 years, while others who “seem” similar, succumb to their disease quickly.

Why is this the case?  Short term survival vs long term survival, aggressive appearance of mets vs slow-growing, good response to treatment vs minimal response?  Why would the same disease be so different?

Easy answer.  It is not the same disease.  Clear cell RCC, that so-called conventional type, maybe 75% of all the kidney cancers, is not really one disease. Clear cell may be subdivided into four separate types, each with its own survival pattern–and all due to its early genetic drivers. Researchers have been able to sort out the genes, compare the mutations, deficient or over-expressed, and find them in tumors of patients who were treated and followed over many years.

Just as there is no magic bullet, no one medicine that fixes everything, there also seems to be no one poison bullet.  It is not just one thing that goes wrong, one nasty gene breaking the DNA rules, but a combination.  And there will be more combinations.  This is like the typical disaster stories, where it is not just one thing that goes wrong, but a series of events and changes.  Each one of the series might not create a problem, but in combination and with the right timing, there is a perfect storm–the very aggressive tumor.

Without getting too technical, clear cell RCCs can have a mix of genes that mutate.  Recent studies have shown that two genes in particular, BAP1 and PBRM1 can either be sufficient (or competent or positive) or they can be deficient in their expression.  There are four possible combinations, positive for both genes BAP1 + and PBRM1+, negative for both genes BAP1- and PBRM-, and combinations with the BAP1+ and PBRM-, and the reverse, BAP- and PBRM+.

Why does this matter for the study patients? All of them had localized disease at the time they were diagnosed and all were clear cell patients of similar age.  BAP1 was mutated/inactivated/deficient in about 15% of these patients, and that mutation was associated with high nuclear grade, or a more aggressive type of tumor.

About 50% of clear cell patients had the PBRM1- tumors. Others had a mix of one gene positive and the other negative. Mutations of BAP1- and PBRM1- were rarely found together, but that combination predicted poor survival, in one study of just 2.1 years.   Having just the BAP1- had an overall survival of 4.6 years median, while the deficiency of PBRM1 (-) had an overall survival of 10.6 years.

This shows that clear cell RCC is really not one disease type, but four.  Most importantly for patients is the knowledge that these varying mutations may respond to different medications.  Also, these mutational differences can be seen in immunohistochemical or pathology tests, which can give greater guidance to treating physicians.

Coming soon is another lectures by Dr. Brugarolas, so watch this space.

Leave a Comment

Filed under Genomics & Genes, Lectures from Experts, RCC Basics

Younger Patients & Kidney Cancer: Your Genes or Your Luck?

Once you reach a ‘certain’ age, you are horrified, but not surprised to get a cancer diagnosis, or hear about it in a loved one.  That same cancer in a young person is even more horrifying, we instinctively know.

Most kidney cancers (and there are more types than we previously knew) are found in people in their 60s and 70s.  Bad enough, but a cancer called by the same name and found in a younger person is often a very different cancer, with a very different prognosis.

Some new research recognizes that special attention should be paid to those RCCs found in patients 46 years of age and younger.  Why is this?

The quick answer is that this may represent a more aggressive kidney cancer and/or be of a familial or hereditary nature.  That important distinction has researchers strongly recommending that young patients be referred for genetic testing.  This can explain those special risks and create more appropriate treatment plans, and alert other family members as to special monitoring. Critically it may change the approach to any removal of the kidney and/or tumor.

Typically a small renal mass might be monitored or removed by either surgery or some laser ablation.  If removed, the tumor can be assessed by a pathologist–a look under the microscope.Without a prior biopsy, the ablated tumor will not be examined, and no genetic testing can be done.

BIG HOWEVER HERE: even with a good pathology report, that may tell only what that tumor looks like–not what pushed it to grow, i.e., the genetic drivers. And those genes don’t go away with the tumor, so the risk remains that more tumors will grow, maybe in the second kidney, or in the partially removed kidney.  Plus the rest that can happen with cancer…

An 75 year old whose small renal mass is removed will likely function well with one kidney.  That same tumor  in a 35 year old creates another challenge.  If that tumor is driven by familial genes–not just by sheer bad luck–more tumors on the other kidney may be in the works.  A partial nephrectomy   must be considered. The risk of more tumors emerging in that kidney AND the other kidney is high.  The younger patient needs decades of good kidney functioning, but those decades carry the risk of the emergence of more mets.

What else should trigger a genetic testing?

Quick answer: anything that doesn’t look like the senior  citizen with a single tumor in one kidney.  More officially below:

Early onset of kidney cancer is 46 years or less.

Bilateral (two-sided) or Multifocal (many locations) kidney tumors

Family history of kidney cancer, 1 or more close relative, 2 or more in more distant relatives

Kidney cancer with either a mix of other tumor types roughly related to kidney cancer or with lung cysts or pneumothorax (air leaking out of lung into chest cavity)

Personal or family history of kidney cancer syndromes.

The above list is from Yale  School of Medicine, Professor Brian Shuch, who work includes dealing with heredity forms of kidney cancer.

More small renal masses found at an earlier age in more patients, as our imaging techniques improve and more CTs scans are done. Not all will be hereditary, and many will be sporadic or out-of-the-blue kidney cancers.  Those are likely due to the sheer chance. Things go wrong as trillions of cells divide and make DNA mistakes along the way. Years of environmental damage may overwhelm the body’s ability to correct those DNA mistakes–i.e., the immune system gets overwhelmed, tricked, tired, etc.

Kidney cancer found at an early age or with the bilateral/multifocal tumors simply must be tested as to it genetic origins.  This gives information critical to protect the rest of the kidney(s) and to participate in treatment that is more helpful.  Finding an effective treatment will still be a challenge, but proper treatment requires knowing exactly which kidney cancer you have.  From there, a real plan can be developed.

Just as I remind all readers to work with an experienced RCC oncologist–not just a surgeon and/or urologist (sorry guys, we need a team)–those who fall into this early and hereditary renal cell carcinoma category must also work with super specialists.

The person to contact at NIH is genetic counselor Lindsay Middelton at (301) 402-7911. She is with the National Cancer Institute’s Urologic Oncology Branch.  An introductory link is below to the NCI and two other rare kidney cancer organizations.

http://www.cancer.gov/cancertopics/causes-prevention/genetics/genetic-testing-fact-sheet

Birt-Hogg-Dubé syndrome:
http://www.bhdsyndrome.org/for-families/what-is-bhd/

Other syndromes causing kidney cancer:
http://www.bhdsyndrome.org/for-families/kidney/other-causes-of-hereditary-kidney-cancer/


1 Comment

Filed under Ablation & Radiation, Basics, Genomics & Genes, Making a Plan, Newly Diagnosed, Rarer RCC Cancers, Surgery, Uncategorized

Oligometastases?! Patients Changing the Rules

Kidney cancer is the focus here, but I can’t resist writing about the empowered and determined lung cancer patients who changed the rules–the NCCN guidelines–in treating their  cancer.  With this, there is  support for treatment for their newly established metastases which was previously lacking.  Translation for the patient was, “It’s come back, so just go home. End of story.”

What does this mean for kidney cancer patients, or for others?  For that matter what does “oligometastases” mean anyway?

” Oligometastases are defined as 1–5 distant metastases that can be treated by local therapy to achieve long-term survival or cure.”

Earlier, some doctors felt that there was no reason to treat a patient who was initially diagnosed with metastatic disease.  If the cancer had already metastasized, nothing that could be done, not even the removal of the primary tumor.  Oddly enough, patients often got no treatment and the self-fulfilling prophecy worked again.

We kidney cancer patients know better. (My 10cm tumor and the lungs full of mets would have NOT been treated by many doctors.)  Removal of the primary tumor can have real benefit, even when there is no treatment for the metastases.

Similarly, the emergence of mets post-surgery was also seen as a “game over” by many doctors.  The “got it all” surgery that was welcome news was suddenly a forgotten phrase. How many sad visits a year or two after of misplaced confidence? Kidney cancer will come back far too often, suddenly emerging near the old tumor or in some of the favored spots.  With kidney cancer, that is the lungs, bones, adrenal gland and the brain.

These new mets, generally in the area of the primary, are those oligomets.  Hard enough to say, and harder yet to be told that the docs will do nothing–because the guidelines say it is not worth it.  That was the situation for non-small cell lung cancer patients with new mets.

But these cancer patients were NOT having that kind of non-help!

They gathered all the data, showed the value of going after these mets and convinced the NCCN to make significant changes in their guidelines.  Now doctors and the insurance people cannot deny these treatments on the basis of these guidelines.

Patients helping patients, patients helping doctors, patients helping create better guidelines, patients living longer…might be a trend we can emulate.

LITTLE BACKGROUND:

Keep in mind that most doctors and insurance companies want to use treatment guidelines based on some acceptable medical standards.  One guideline comes from the National Comprehensive Cancer Network.  This establishes the working rules for what kind of treatment or monitoring is thought appropriate for any stage of cancer.  For example, the treatment for a Stage I tumor is quite different from that of a Stage IV tumor.  There are guidelines for shifting to new medications, and for monitoring of primary tumors or mets after surgery.

Since kidney cancer most often metastasizes to the lung, I monitor some of their sites, and was thrilled to see this.  Power to the patients, people!

http://www.curetoday.com/community/tori-tomalia/2015/03/empowered-patients-change-national-cancer-guidelines

3 Comments

Filed under Guidelines, Patient Activism, Patient Resources

Recurrence? Is There an App for That–or a Medicine?

Being diagnosed with kidney cancer is a stunner.  Facing surgery and endless, oft unanswered questions changes your life.  Patients with small tumors, easily removed, are often told not to worry about it coming back.  Of course, there is ALWAYS the possibility that even small “I got it all tumors” can recur.  Sadly, the current guidelines fail to catch about 30% of recurrences, using the 2013, 2014 guidelines.  These guidelines were from an earlier era, where there were fewer small tumors found, so there was data lacking on long-term follow-up.

We patients ask? “Why not just take the meds that the patients with metastatic disease do?  Wouldn’t that prevent it from coming back?  If it works to fight the mets, why wouldn’t it prevent new ones from getting a foothold? “

Why not use the meds that they use now against metastatic disease? Why wouldn’t that work?  Have they tested that idea?

In February of 2015, a study was released which comparing patient response to 1) sunitinib (Sutent),2) sorafenib (Nexavar), or 3) placebo (no real medicine).  This  three-arm study included 1,943 patients who had locally advanced clear cell and non-clear cell histology RCCs. They were thought to be at high-risk for recurrence of their cancer, and might benefit from “adjuvant” therapy.  The researchers hoped that they would see a 25% improvement in time to recurrence of disease with the meds vs no meds.. That would means that the typical 5.8 years median Disease Free Survival (DFS) would go to 7.7 years.

Sadly, there was no benefit to taking the active drugs compared to the placebo.  More sad is that the patients had side effects associated with the drug, referred to as “adverse events”. In fact, many dropped out of the active agent arms into the placebo arm, certainly knowing that the med they were taking were anti-cancer meds.  Those “adverse events”, severe fatigue, hypertension or hand-foot reactions, were observed in those taking the active agents and rarely in the placebo patients.

The median time on the drugs was 8 months.  That means half the patients  were on drugs more than 8 months and half were on the drugs less than 8 months.  Even those patients starting with lower doses of the drugs fared worse than the placebo group.

Despite taking the medications and enduring the side effects, the recurrence was about the same.   With medication or without, these patients, as groups, did the same.  Those taking the meds had Disease Free Survival of 5.6 or 5.7 years, similar to those not taking any real meds.  There was no real added benefit to these patients.  Certainly the quality of the life was affected by the side effects, and the constant reminder of the spectre of more cancer.

What can patients learn from this study?

The fear of recurrence is real. After all, the expected time until the disease progressed (love using that term for cancer!), was about 5 1/2 years.  These patients were carefully monitored with CTs on a regular basis, which caught their recurrences as soon as possible. Had they not been in this trial, it is reasonable to expect that many would not have received those scans and not know of the recurrence as it happened.

The reality is that the typical patient may or may not continue to be monitored. Even those who passed the 5 1/2 year mark without recurrence may not realize that RCC can come back.  Again, 30% of recurrences in small, non-metastatic disease are not caught.  One can assume that the higher risk group in this trial would also be at risk for that level of recurrence.

Take-home message: At present, nothing has been shown to prevent recurrence of this locally advanced disease. Even the non-metastatic small tumors that have sent out invisible “wanna-be mets”, and no one can yet guess who is at the most risk.

The best approach is to monitor yourself and your general health and to demand CT scans, especially in the lungs, where metastatic RCC is most likely to start.  That does NOT mean an x-ray, as those mets would have to be about 1/4″ in order to be seen.  My own lung mets were under that size when first found, but there were hundreds of them, and they grew quickly.  Not visible on an x-ray, but growing every day.

Despite the disappointing study above, the ASSURE study, more clinical trials are recruiting patients for similar studies using drugs that have already been shown to be less active than those in the ASSURE study.  I would be cautious in getting into such a trial, and would spend my energies seeing that my monitoring is extended at least until 10 years past my surgery–even with those “got it all” primary tumors.


Leave a Comment

Filed under Clinical Trials, FDA Meds & Trials, Guidelines, Medications, Targeted Therapies, Uncategorized, Your Role

“Got It All!” or “Gotcha!” The Guessing Game…

No one wants to look for extra trouble after having been diagnosed with kidney cancer, even if the tumor is small.  Horrified already by the cancer, it is more horrifying to realize that there are no guarantees, even when told by a reassuring surgeon that he “got it all”.  The reality is that even small masses can have sent out cells to other sites, in the rest of the kidney, should it have remained, or to distant sites.  (In cancer, ‘distant’ is never as distant as it should be, as that means there is cancer in some area away from the primary tumor.  Could be lungs, bones or brain, sorry to say.) So now what do you do?  And what can you do?

With the more sensitive imaging techniques, x ray, ultrasound, CT scans, and MRIs, more smaller tumors are being found.  The hope is that finding and removing them will be completely curative, and there are plenty of papers to say that is the case.  But is it really true?  Unfortunately, finding tumors sooner also means that they may need to be “followed” or monitored longer than has been done in the past.

Consider the situation where a tumor about 2 inches in size is found, and scheduled to be monitored for five years.  Though with no symptoms, the patient gets that “last” scan, only to find a newly visible met. Not visible at the year four scan, it may have been slowly growing , unseen for 2-3 years  There may be further monitoring, and perhaps a surgery to remove it or one of the newer drugs is given, in hopes of downsizing or stabilizing the met. Happily the five year plan worked to catch this one.

Had that same tumor been found two years earlier, maybe just 1 inch in size, and monitored for five years, no further met would have been found.  The monitoring may well stop at five years, while the slow-growing met continues to grow, still not visible to the scan. It may only be symptoms at year 7 or 8 which brings the patient back to the doctor, and this time with larger and perhaps more mets, not visible at the year five.

Older monitoring schedules were based on the low and grim expectations for kidney cancer patients. There was little thought to tracking patients for more than five years. After five years there weren’t that many patients!

With earlier detection, and more treatment options, now is the time to review monitoring to capture recurrent disease, which we patient call, “It came back.”

We do look to the five year mark, thrilled to have made it, especially so if we have been cancer-free. Not quite like graduation, but more like the beginning of summer vacation.  But we (and our doctors) must be reminded to keep checking back in with the school principal/CT scan. We need to be sure no leftover bunch of cancer cells have become a measurable metastasis.

Let’s talk about size, as it really matters.  So does the attitude–aggressive or indolent–of the cells of  even the tiniest tumors.  Some may well have sent out their own colonists, looking for areas to set up housekeeping.  Clear cell RCC most often goes to the lungs, so lungs deserve close attention. X-rays can only see a pea-sized met, about 1 centimeter in size, so a CT scan, with and without contrast is best to find new mets.

What are the chances of finding mets, either sooner or later, with a small renal mass?  Lots of stats and some terminology here, so take notes as needed. Better yet,  grab your own post-surgery report, or the imaging reports so you know where you stand.

Measuring Small Renal Masses

Primary kidney tumors are measured on a T (for primary Tumor) scale that runs from TX–no primary tumor found, to T4, which is any tumor 10cm or larger(There are 2.54cm to the inch, so that is 10cm/2.54cm=3.9 inches.  Think four inches, and remember that it can be shaped like a potato, not a ball or a pancake. They can be measured  at a different spots in different scans. That is why measurements can vary from report to report.

T1 tumors are divided into T1a and T1b, and are limited to the kidney.  T1a tumors can be up to 4cm in size, using the largest dimension. Officially this is the small renal mass. Volume counts in the real world, but a 4cm x  2cm will be described as the same size as a 4cm x 4cm tumor.

Tumors which are named at T1b size are still limited to the tumor, but can be up to 7cm in the longest dimension, so about 2 3/4 inches long. The officially small renal masses   No longer described as small, it SOUNDS small by the name.  Assuming that there is no other evidence of cancer outside these masses, this is Stage I cancer. Given the grade of the biopsied tumor, it may be considered to be low or high grade, which is a measure of the aggressive nature of the tumor.

Tumors in the T2 range are also divided into T2a and T2b.  These are still limited to the kidney, with the division at the 7cm mark. T2a tumors are over 7 centimeters (think 3+ inches), and up to  10 centimeters, nearly 4 inches


Leave a Comment

Filed under Guidelines, RCC Basics