
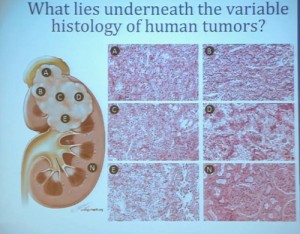
Why don’t the various medications work better for RCC? Why do some patients do well, and others so poorly? Why is it so hard to choose the right medicine?
This lecture explains why patients and doctors must play the guessing game in treatment. It may be the most important lecture in this blog, and provides an explanation as to why RCC cancers behave so differently, even those variants with similar pathologies. (My notes are in italics, like this, added to help with this complex discussion…I hope.)
Presented by Dr. James Brugolas, MD, PhD.: Kidney Cancer Program Leader Associate Professor of Internal Medicine & Developmental Biology; University of Texas Southwestern Medical Center
http://www.chemotherapyfoundationsymposium.org/mobile/player.php?id=476
“I am going to talk to you today about the genetics of kidney cancer and how I believe it is paving the way for the next generation therapies. There are no significant disclosures.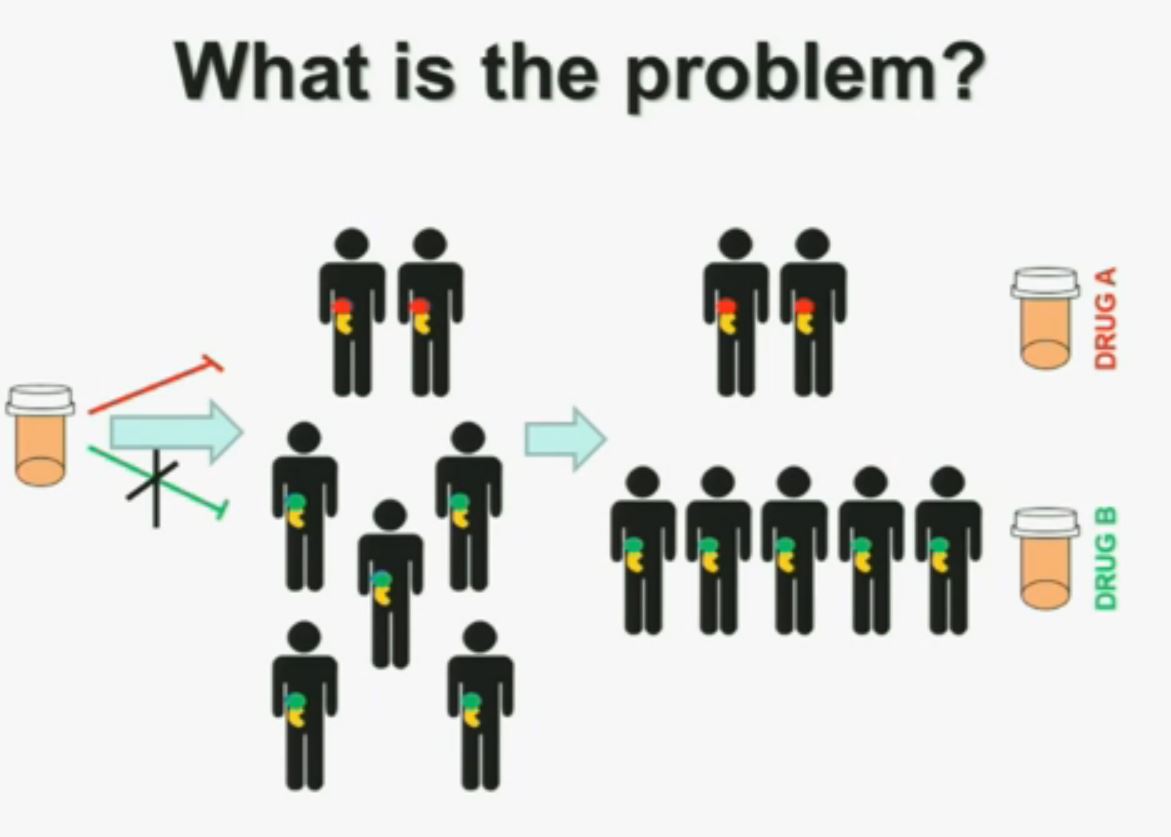 What is the problem? This is a problem that we are well aware of some nowadays. We’re using one drug for all patients with kidney cancer. You may imagine that these are all patients with metastatic renal cell carcinoma. But it is a heterogeneous population. Some have the red tumor, some of them the green tumor, and the drug may work with a subset of patients, but it may not work for another subset of patients.(Left half of the slide with the meds not reaching the patients with GREEN tumors.)
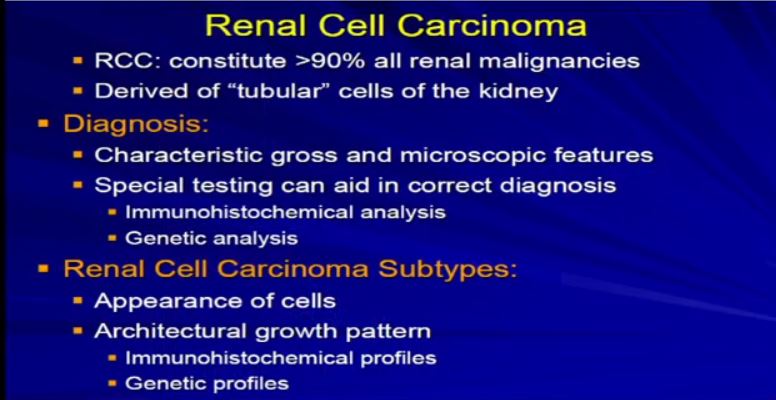
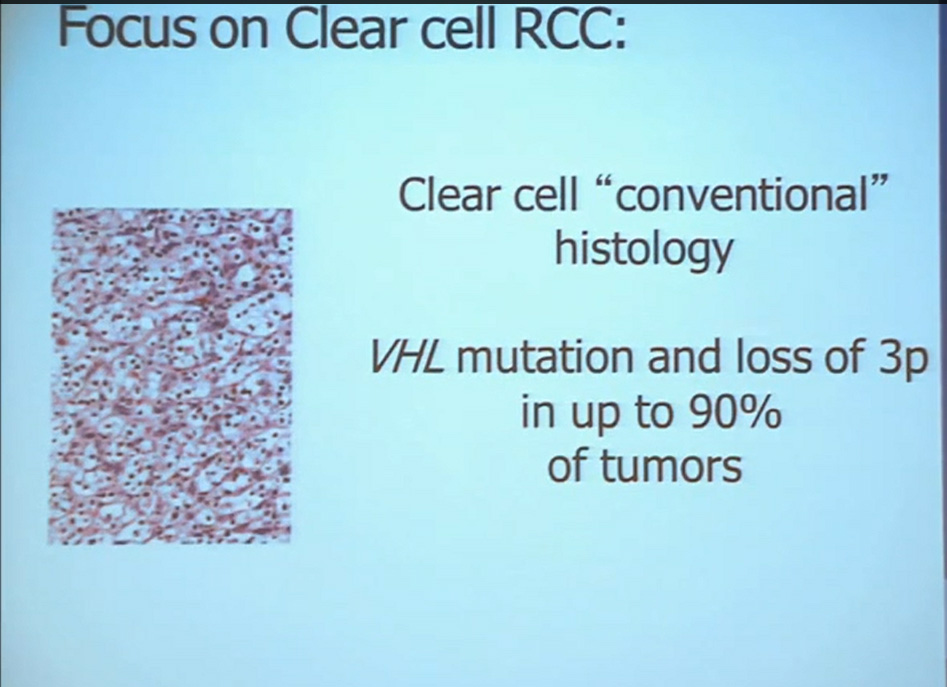
We should be evolving to a paradigm where patients with different tumors are treated with different drugs. (Right half of slide shows Drugs A and B going to different subsets of patients.)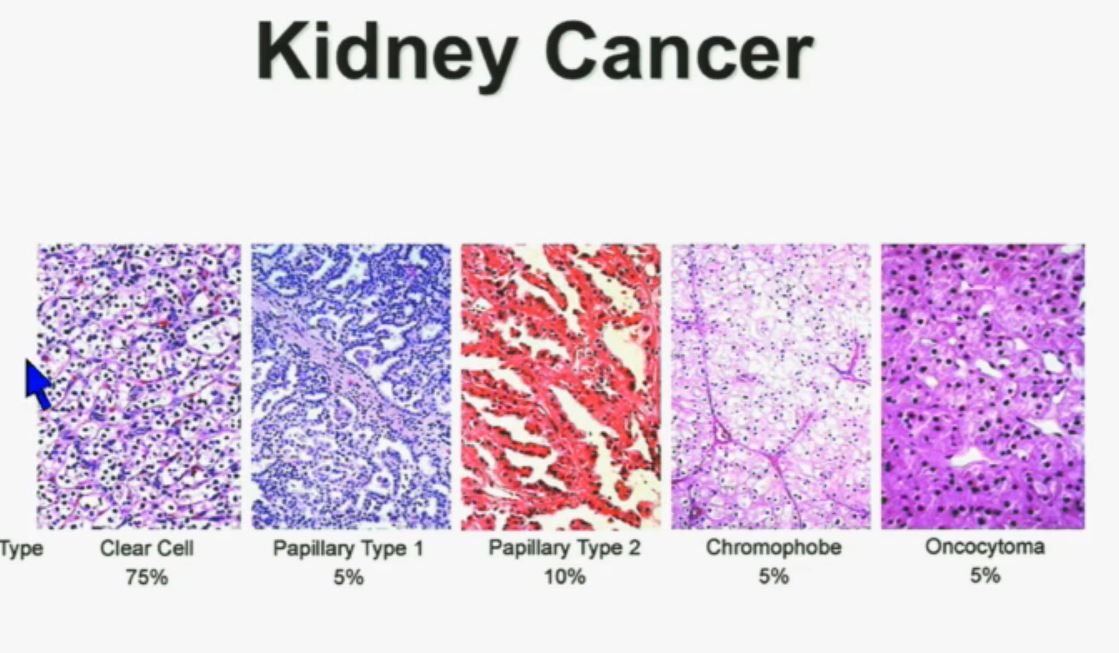 In the context of renal neoplasms , as you are well aware, we have kidney cancer with clear-cell carcinoma which accounts for the vast majority (75%) of that, and that’s going to be the focus of the first part of the talk.
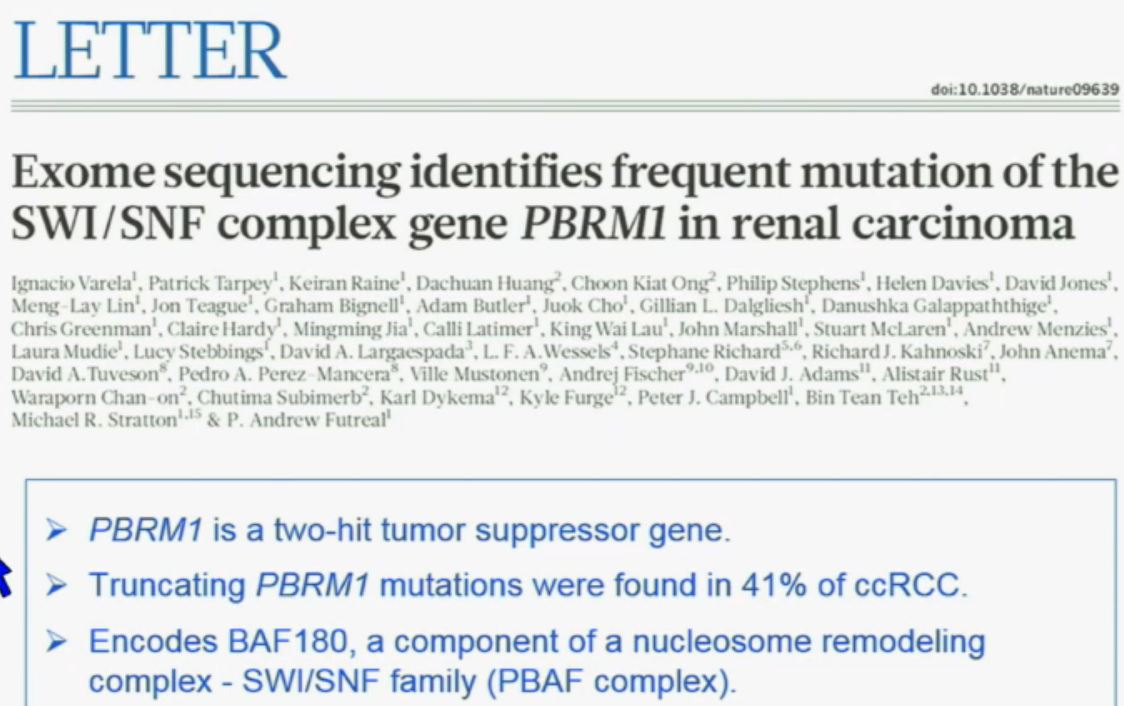 The work from the Sanger Institute by Andy Futeral and Michael Stratton led to the identification of mutations in the PolyBromo1 gene. Polybromo1, like VHL, the most commonly mutated gene in clear cell renal cell carcinoma, is a two-hit tumor suppressor gene. That means both copies are mutated in tumors. They identified through truncating mutations in approximately 41% of clear-cell RCC. PolyBromo1 encodes BAF 180, which is a component of a nucleosome modeling complex which may regulate, among other processes, transcription.” (Peg & Wikipedia say that transcription is the first step of gene expression, where DNA is copied into RNA, giving instructions. Pretty basic cell info.)
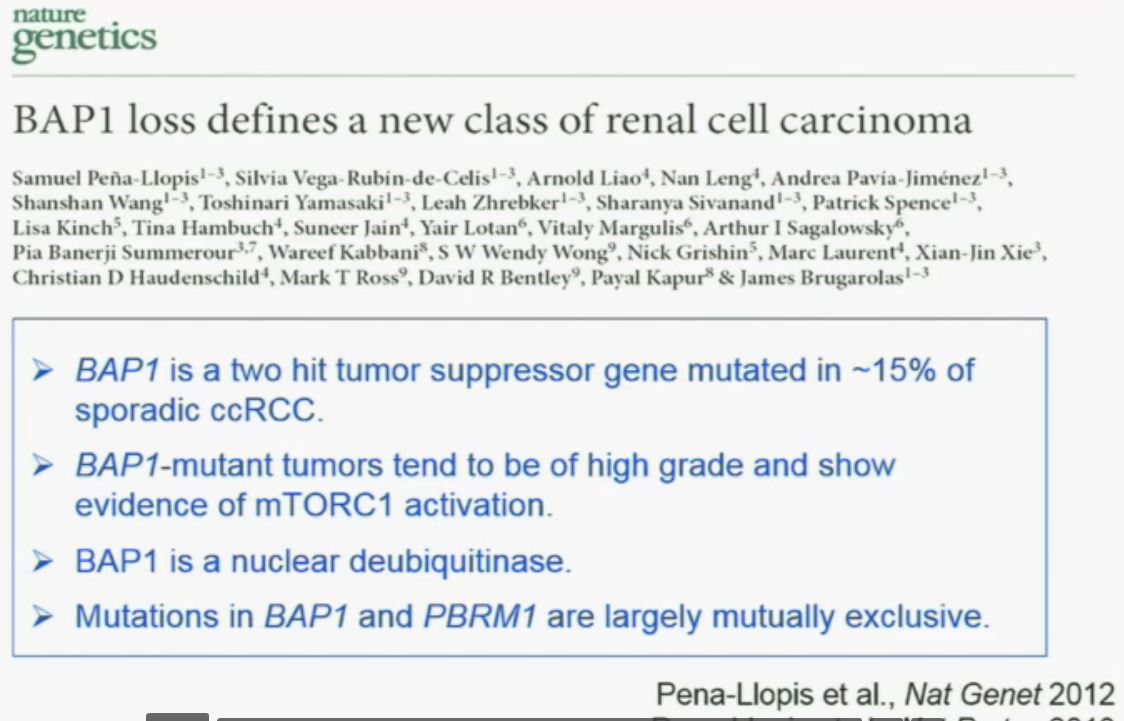
“Work from my laboratory led to the discovery of another gene mutated in RCC, the BAP1 (BRACA1 associated protein-1) gene. Like the BPRM1 and VHL, BAP1 is a two-hit tumor suppressor gene, but it is mutated in only about 15% of sporadic clear-cell RCCs.
This work was done focusing on tumors that were of high grade. Indeed, we found there was a correlation between BAP1 loss and high grade, and also activation of the mTOR1 pathway. BAP1 encodes a nuclear deubiquitinase. Of greatest interest, mutations in BAP1 and BPMR1, we found, are largely mutually exclusive. This is shown this more detailed the next slide.
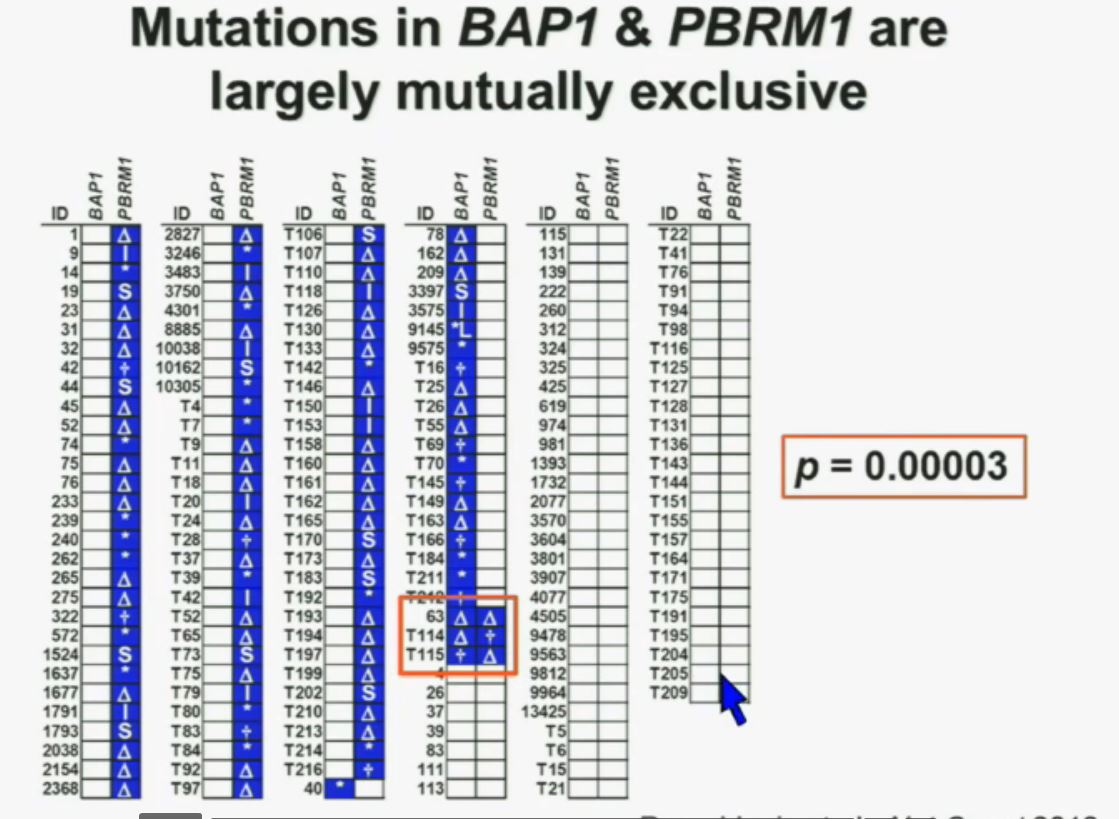 What you are seeing here are 176 tumors, each in a row. These are tumors that have a deletion in PBMR1, these are tumors with the insertion, this with a point mutation (referencing the various symbols P). All the tumors in blue are tumors that have a mutation. As you can see most of the tumors, we see with PBRM1 mutations do not have mutations in BAP1. (Column 4 has many BAP1 mutations.)
(in last column) Here you have some tumors with mutations in BAP1, and we only identified three tumors that had mutations in both genes. (Very end of column 4) The probability of having mutations in both genes was statistically significant. Based on the individual mutation probability, we would have expected 13 tumors to have both genes. Only three were found, suggesting that BAP1 and BPRM1 mutations are largely mutually exclusive.
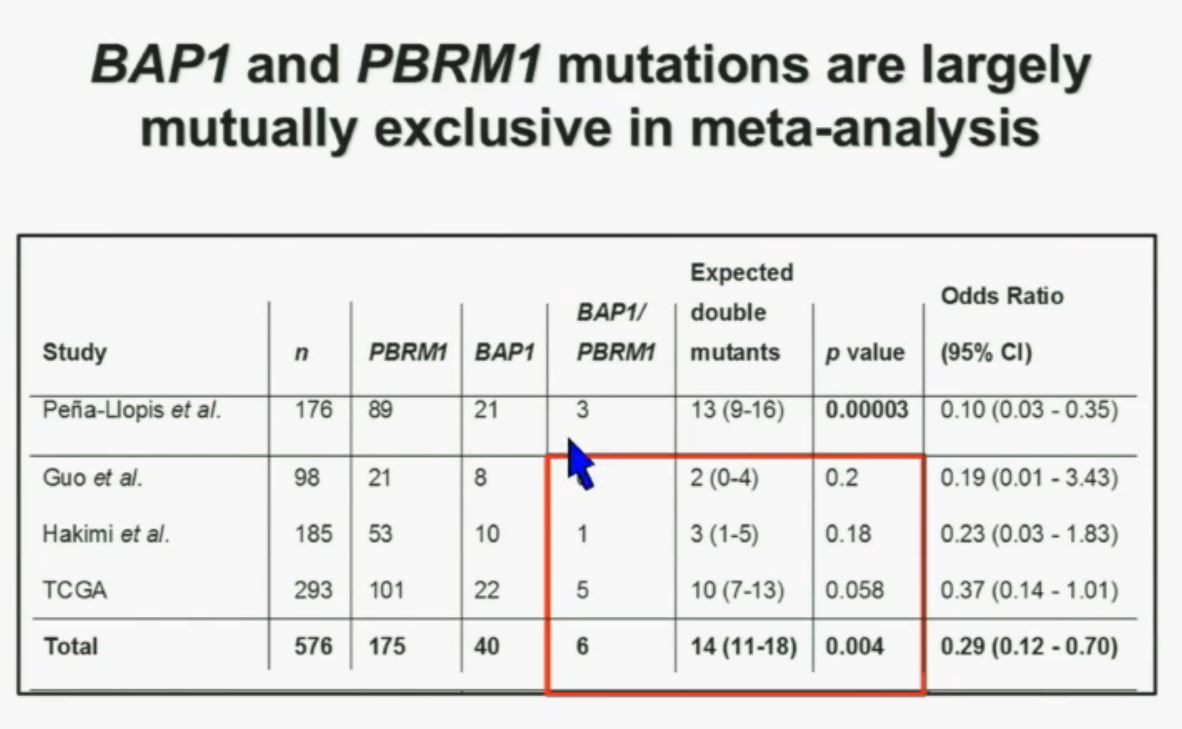 We went on to performing a meta-analysis. This is looking at data from that Beijing Genome Institute, at Memorial Sloan-Kettering and this from the TCGA (The Cancer Genome Atlas). As you can see, even though the numbers are small, the numbers of tumors with mutations in both BAP1 and PBRM1 was reduced, compared to the expected number of tumors based on the individual mutation frequency, and the p value was statistically significant.
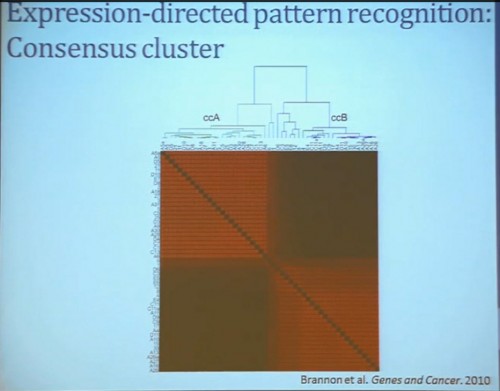
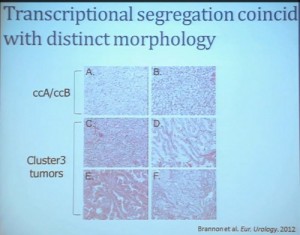
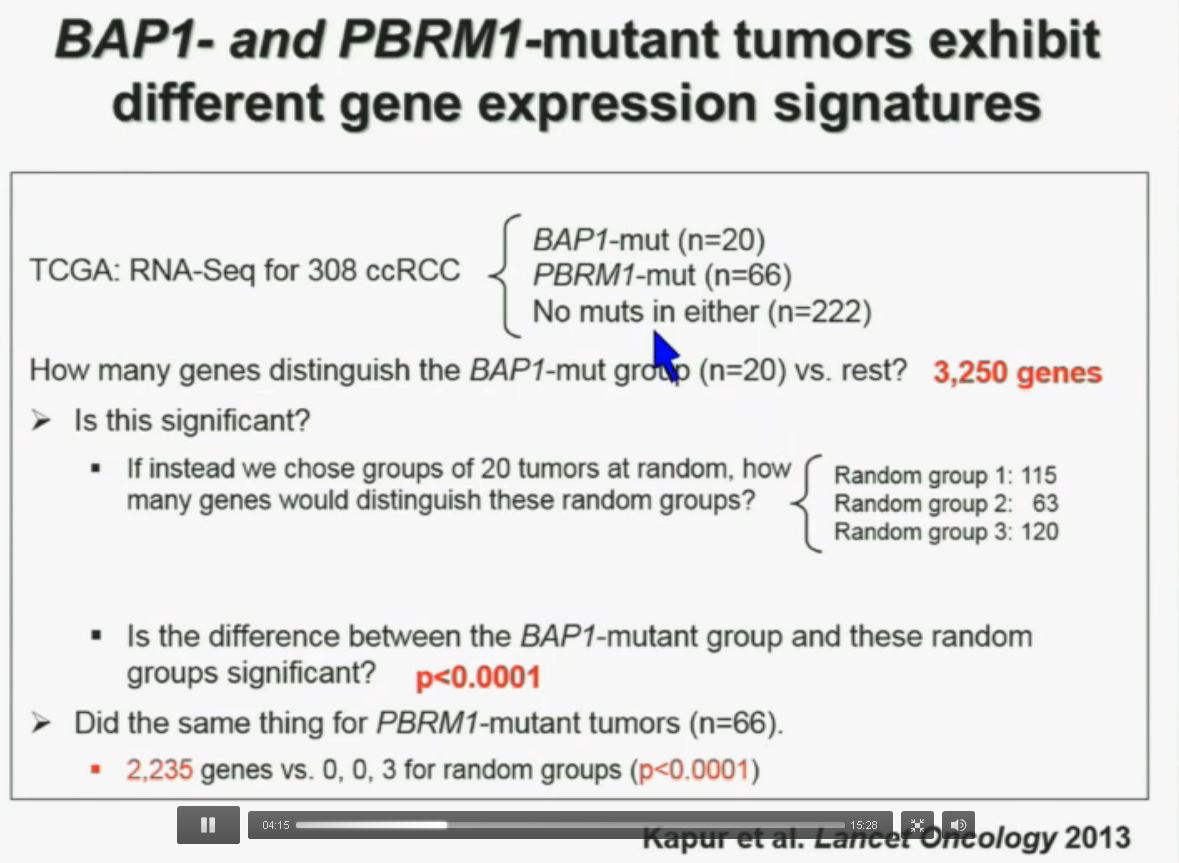 I’m going to go through these and not spend much time, but suffice it to say that that we found that these tumors that have had mutations in BAP1 have a characteristic gene expression signature, and the tumors that have mutations in PBRM1 also have a characteristic gene expression signature. These gene expression signatures do not overlap. These are tumors that have different gene expression patterns and different biology. (Per Peg: this shows that these are biologically different tumors. Notice the different patterns of red and blue below.)
We think this establishes a foundation for the first molecular genetic classification clear-cell RCC. In our series, 55% have mutations in PBRM1, and 15% of the tumors have BAP1, and including 3% have mutations in both. (The balance are wt, wild-type, meaning as it occurred in nature, not mutated.) 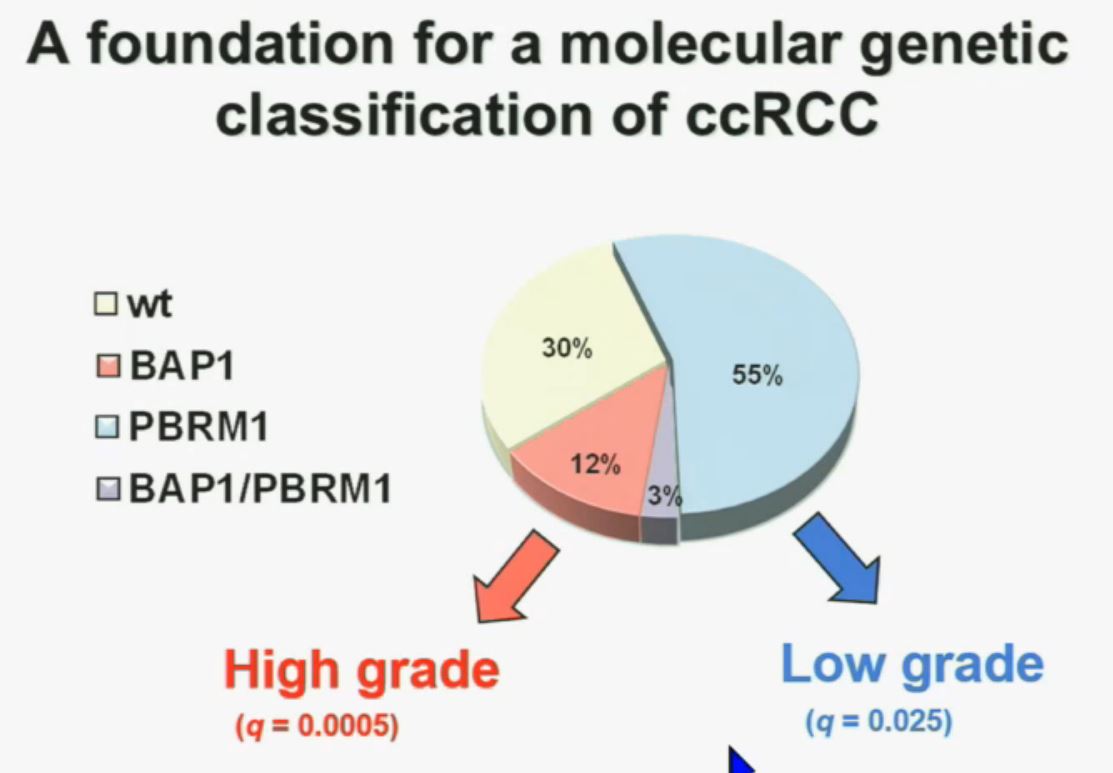 We also observed that there is a statistically significant correlation between mutations in BAP1 and high grade (tumors), and mutations in PBRM1 in low-grade (tumors).
So that let us to propose the following model. This is a model based on the fact that, very interestingly, VHL, BAP1, and PBRM1 are all located on chromosome 3. In fact, the short-arm of chromosome 3, and this is an area that is deleted in the majority of patients with von Hippel-Lindau-associated renal cell carcinoma, as well as in the majority of sporadic renal cell carcinoma, depicted here in blue. (VHL associated RCC is an inherited type of RCC, not arising from a mutation…but along the same chromosome.)
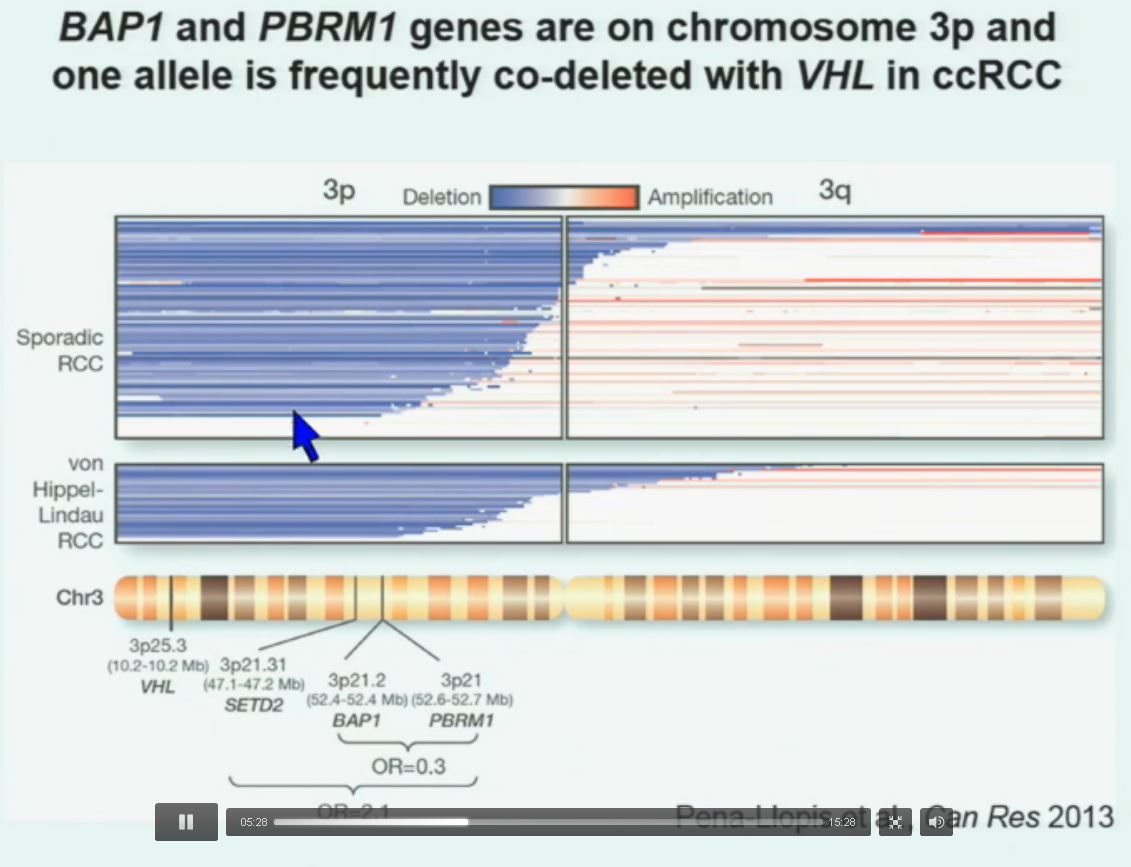 You can imagine that with a single deletion, the kidney cell is losing, in fact, four copies or one copy of these four different tumor suppressor genes, the BAP1, PBRM1 and VHL.
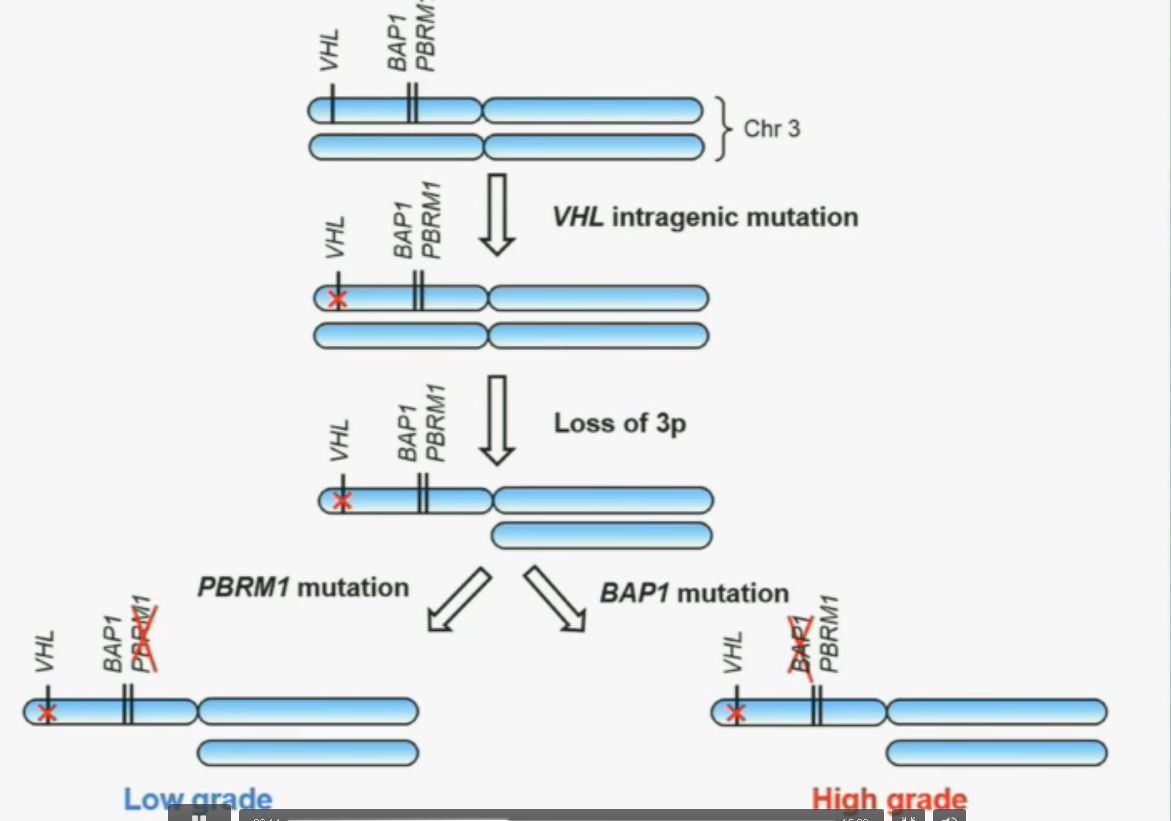
We have proposed the following model. We believe that renal cell carcinoma, and this is consistent with data from Gerlinger and colleagues, that it begins with an intergenic mutation in the VHL gene. And this is followed by loss of 3p, with a concomitant loss of one copy of all of these tumor suppressor genes. We then think that a mutation in PBRM1 leads to the loss of PBRM1 function, which is a two-hit tumor suppressor gene and low-grade tumors, whereas the mutation in BAP1 is associated with the development of high grade tumors.
REFER to ABOVE PIE CHART re High and Low Grades
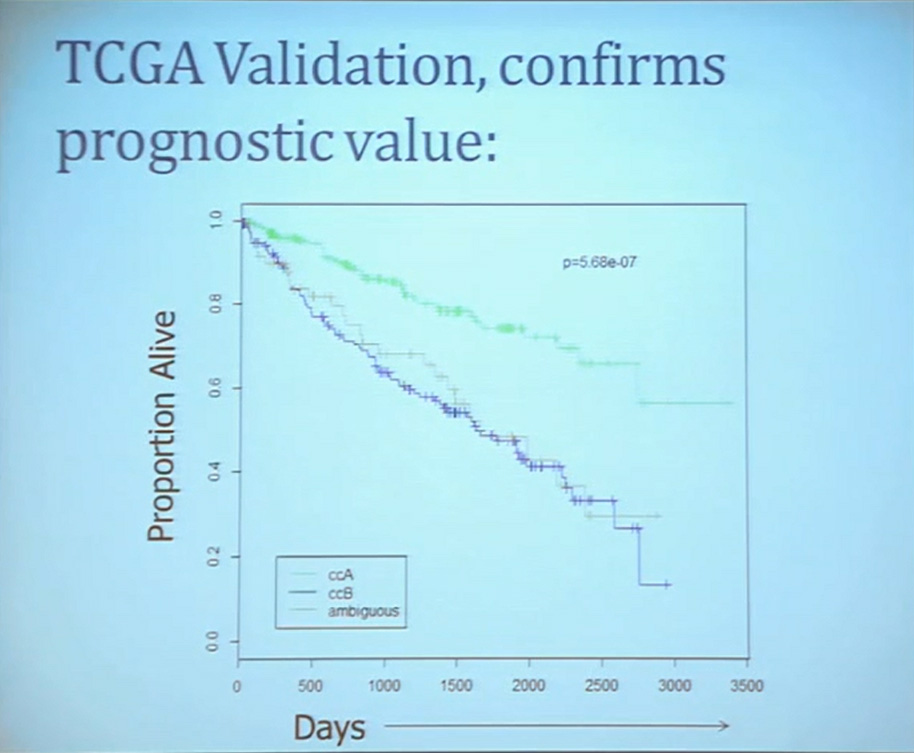
This model also predicts that patients with BAP1 and PBRM1 deficient tumors may have different outcomes. So we simply took those patients whose tumors we had analyzed and asked what happens to their outcomes. (The UTSW and TCGA cohorts reference tumors from different institutions. Blue lines are the PBRM1 deficient tumors, and red lines the BAP1 tumors. The lines which fall the quickest show poorer overall survival.)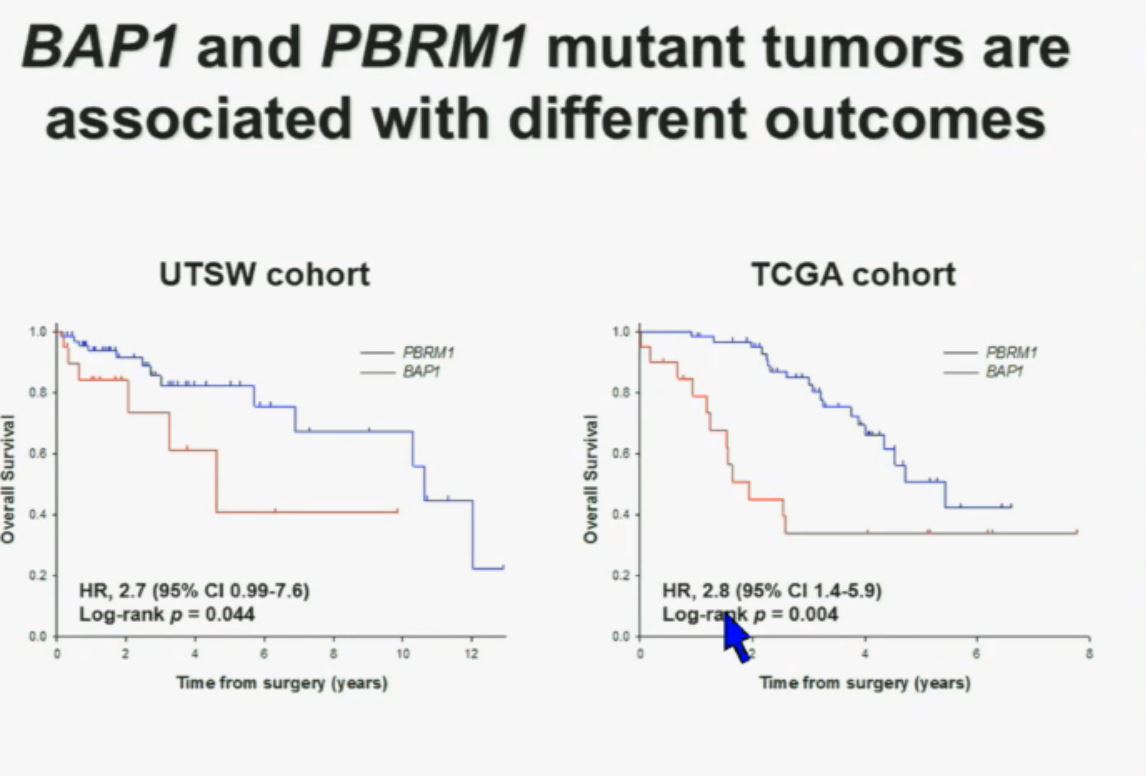 As you can see here (LEFT), we found that patients with PBRM1 deficient tumors had a significant better Overall Survival than those who had BAP1 in their tumors, which had a Hazard Ratio for that of 2.7.
We did a similar analysis with the TCGA cohort, and we found (RIGHT) essentially the same result in the same hazard ratio of 2.8, indicating that BAP1 mutant tumors are associated with worse outcomes in patients. This data has now been reproduced by Hakimi and James Ying at Memorial Sloan Kettering, as well as the TCGA with their own analysis and our colleagues in Japan and Tim Eisen.
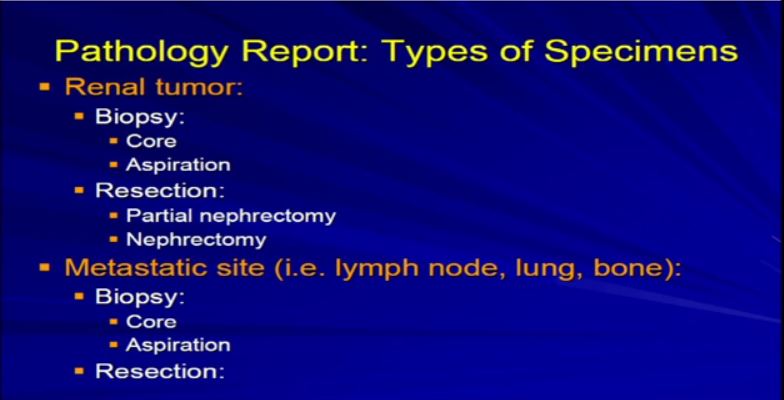
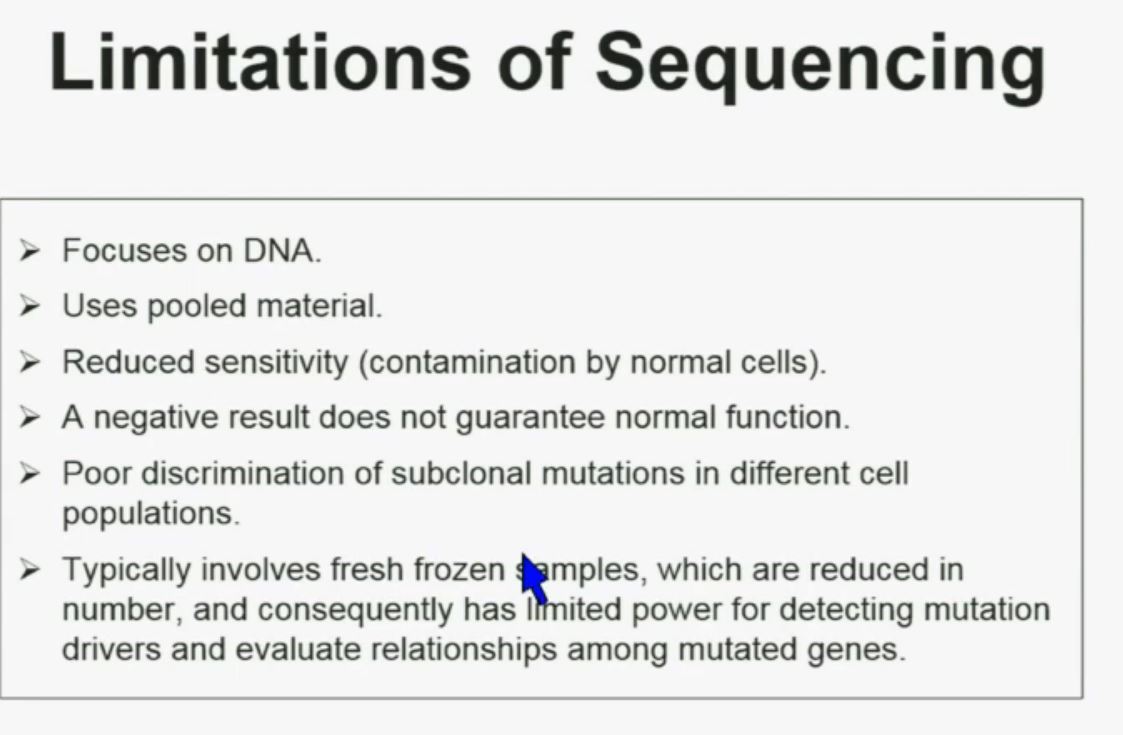 There are some limitations of sequencing. We all like next generation sequencing, but it has some limitations. First, it focuses on DNA. Secondly, it uses pooled material. Thirdly, it has reduced sensitivity which is a consequence of contamination by normal cells. In addition, a negative result does not guarantee that there is normal function. There is poor discrimination of subclonal mutations in different cell populations. So as a consequence of using poor material, we cannot tell whether these mutations are found in the same cells or different cells. Typically, it involves fresh frozen samples which are reduced in numbers, and consequently has limited power for doing some analysis.
Interestingly enough, immunohistochemistry (IHC), which we’ve use for a long time is a lot more precise. This is because actually you get information at the cellular level, and you get information about the protein. I mentioned to you that BAP1 is a two-hit tumor suppressor gene, which basically means when it gets mutated, you lose both copies.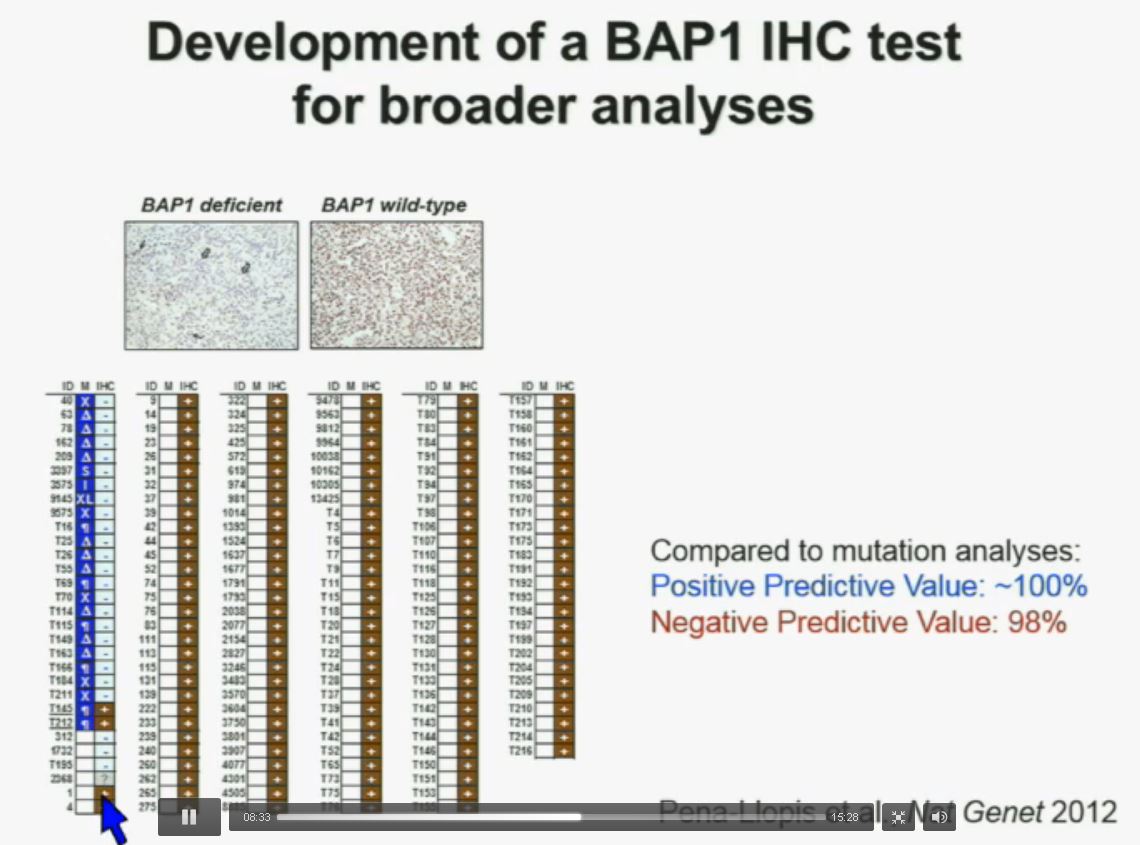 As you can see here–this is the same series showed before. These are here in blue the tumors that had mutations, in the second column, you can see blue and brown, the results by immunohistochemistry. That is done by IHC. And BAP1 is a nuclear protein, as you can see in these beautiful nuclear staining.
The bottom line is the majority of tumors that had mutations (referencing blue column data points) had lost BAP1. There were two tumors with point mutations where we were able to detect the protein. But there were three additional tumors we could not detect protein, but where there was no protein. If there is no protein, there cannot be functioning.
The rest of the tumors, with one exception, were all positive. So compared to mutation analysis, in fact, there is positive predictive value is better and the negative predictive value is pretty similar.
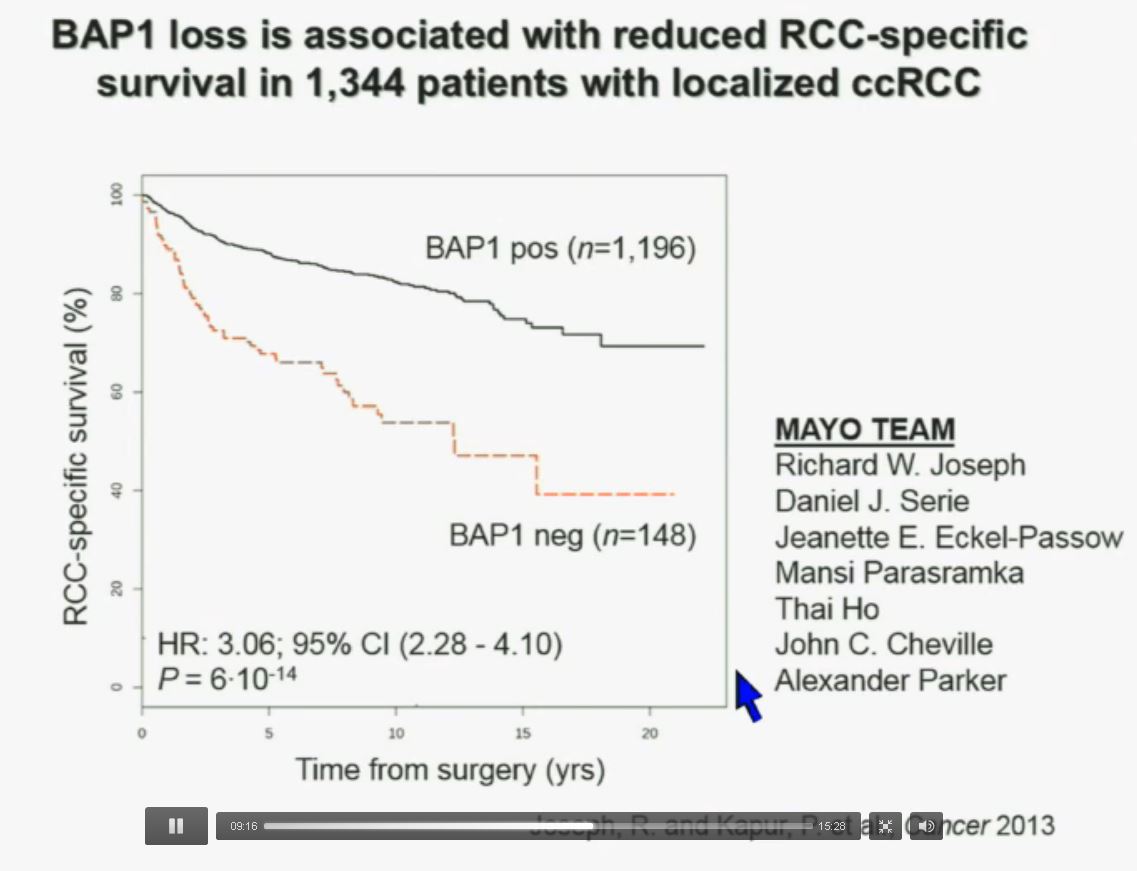
We have used this immunohistochemisty test in conjunction with the Mayo Clinic, looking at their registry with over 1300 with localized ccRCC. As you can see, looking here with people with specific RCC survival, patients with RCC tumors that have BAP1 positive tumors have significantly better survival outcomes than those who have BAP1 negative tumors, again with a Hazard Ratio of approximately 3.
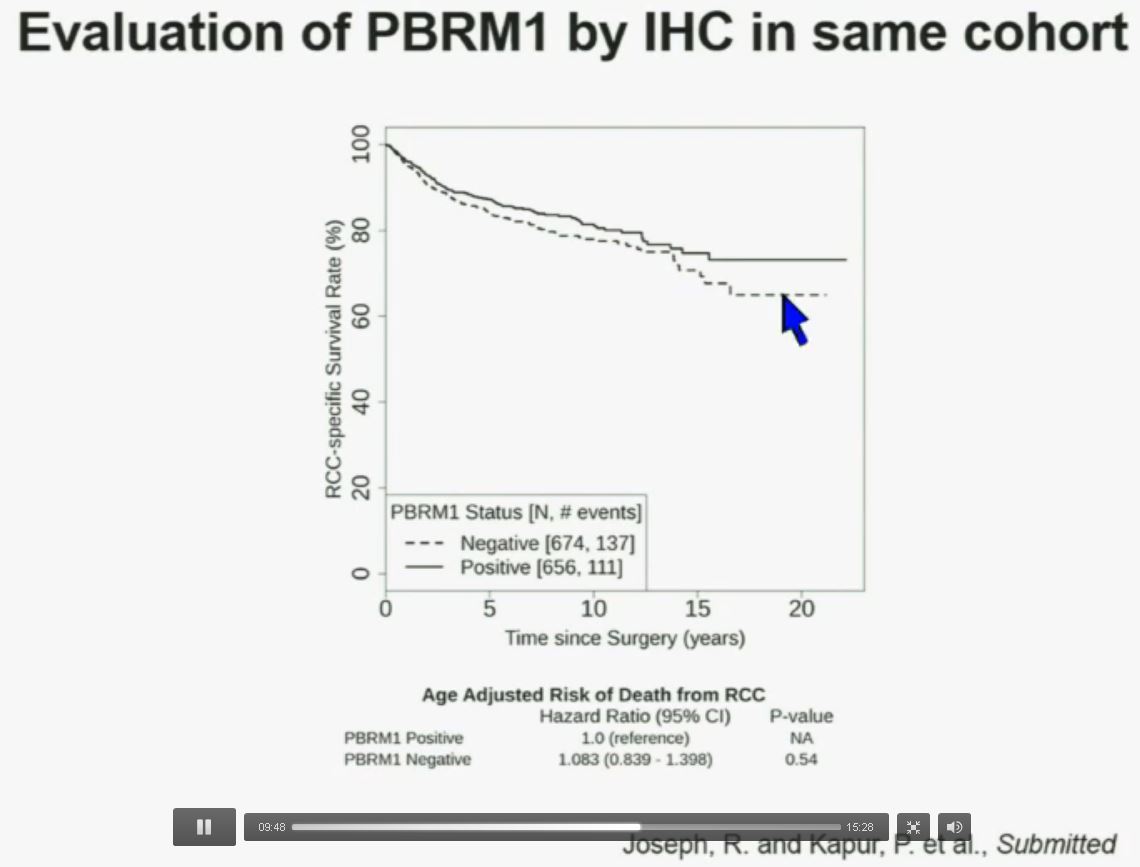 Now in the same cohort we looked at BPRM1, which like BAP1 in a two-hit tumor suppressor gene, and we find no significant differences.
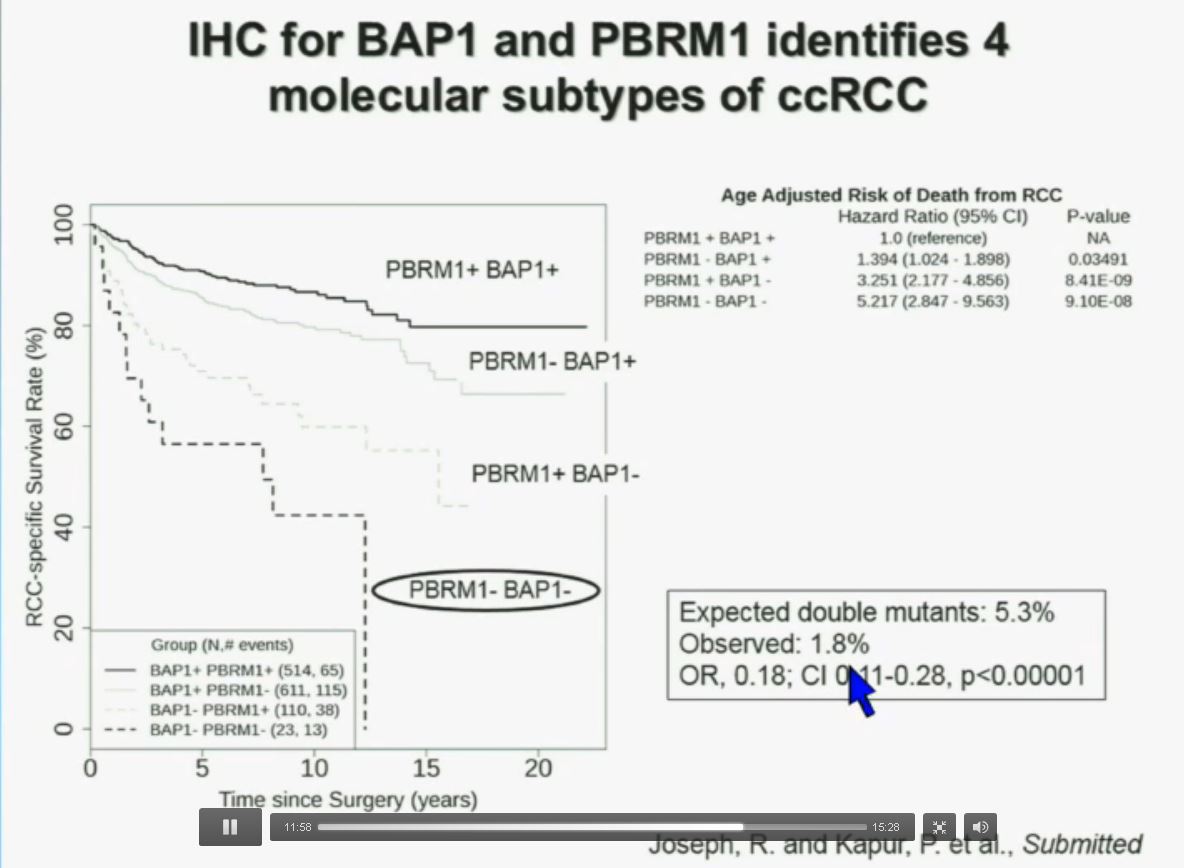 Now in the same cohort we looked at BPRM1, which like BAP1 in a two-hit tumor suppressor gene, and we find no significant differences.
Importantly, this test allows us to identify tumors that are simultaneously mutated for BAP1 and PBRM1. This is important.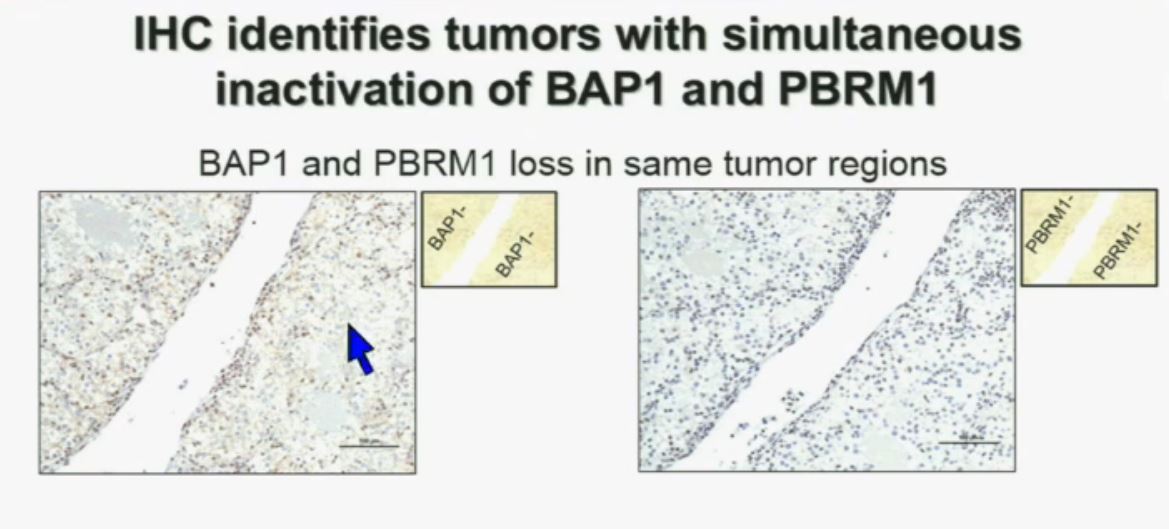 Slide A Slide B
(This slide in presented in two parts to help understand lecture.)
Upper half of slide showing stained pathology images.)
I am going to show you look at this tumor over here (upper left path image A) you can see that the tumor cells, there are some that have brown nuclei, but these are the endothelial and the stromal cells (along the edge of the white). The tumor cells are negative for BAP1.
This is the immunohistochemistry (upper right path image B) for PBRM1, where we find the same thing,where the tumor cells are negative for PBRM1.
 Slide C Slide D
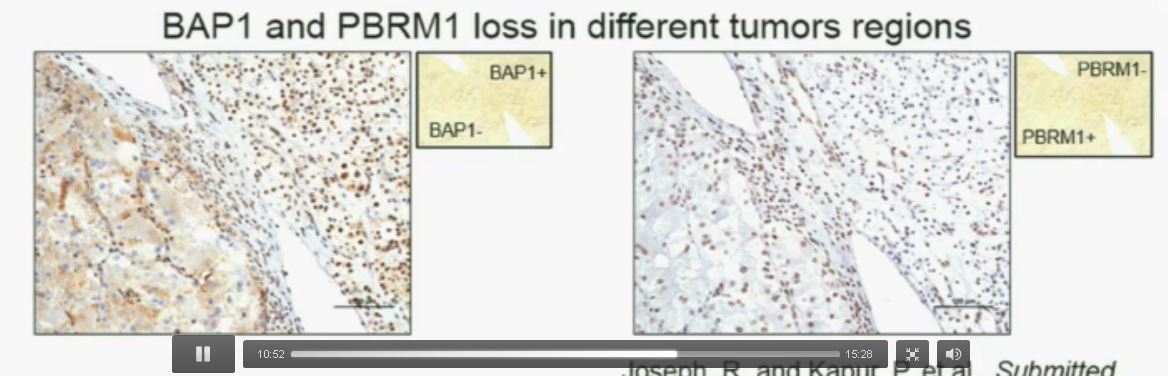
Now (left path image C) compare these tumors with these images below. You can see here that the tumor cells positive for BAP1 in this area (the upper right corner of the path image C) and they are negative (in the lower left corner of Slide C), where you can see specific nuclei which look blue over there.
Now if you look at the parallel section (Lower right path slide D) you can see the area that was BAP1 positive (left hand side???D) is actually also PBRM1 negative, and the area which was BAP1 negative is actually PBRM1 positive.
So what you have over here (in the upper slides A & B) is a tumor which has lost BAP1 and PBRM1 in the same tumor region, the same cells. The tumor has lost BAP1 and PBRM1 in independent regions. Obviously these tumors will be acting differently and the tumor we are most interested in is this tumor type (in the upper left image A).
 Slide should include quote “BAP1 and PBRM1 do NOT predict outcomes independently of SSIGN”
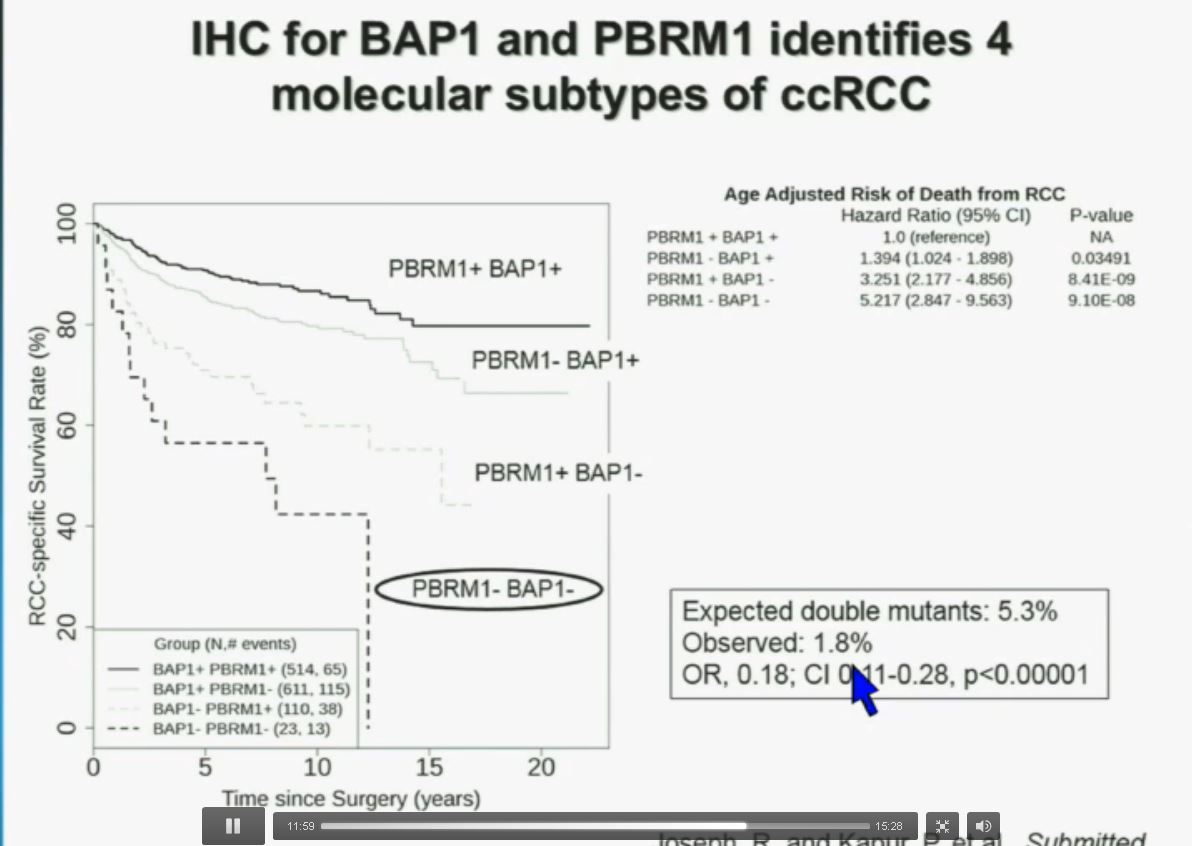
You have seen in our immunohistochemistry test. We believe we can separate clear cell renal cell carcinoma into four different molecular subtypes. This is looking at Mayo registries, where the patients with best outcomes are those whose tumors are well-typed for PBRM1 and BAP1. Then you have 2) patients that have tumors which are deficient for PBRM1, 3) patients that have tumors that are deficient for BAP1, and 4) patients whose tumors are deficient for both. As you can see the Hazard Ratio is 1.3, 3.2 and 5.2, respectively.
As I mentioned to you at the outset, that these tumors were underrepresented and indeed in this very large cohort, we found a very large significant underrepresentation with 1.8% of the tumors being double mutant, compared to 5.3% (which would been expected) with a very highly significant p value, again indicating there is mutual exclusivity–for reasons we do not yet understand.
Importantly BAP1 and PBMR 1do not predict outcomes independently of SSIGN. SSIGN is the nomogram created by the Mayo Clinic, which is based on Stage, SIze, Grade, and Necrosis. This is the SSIGN nomogram; this is the independent validation. You can see the curves separate beautifully, depending upon the score.
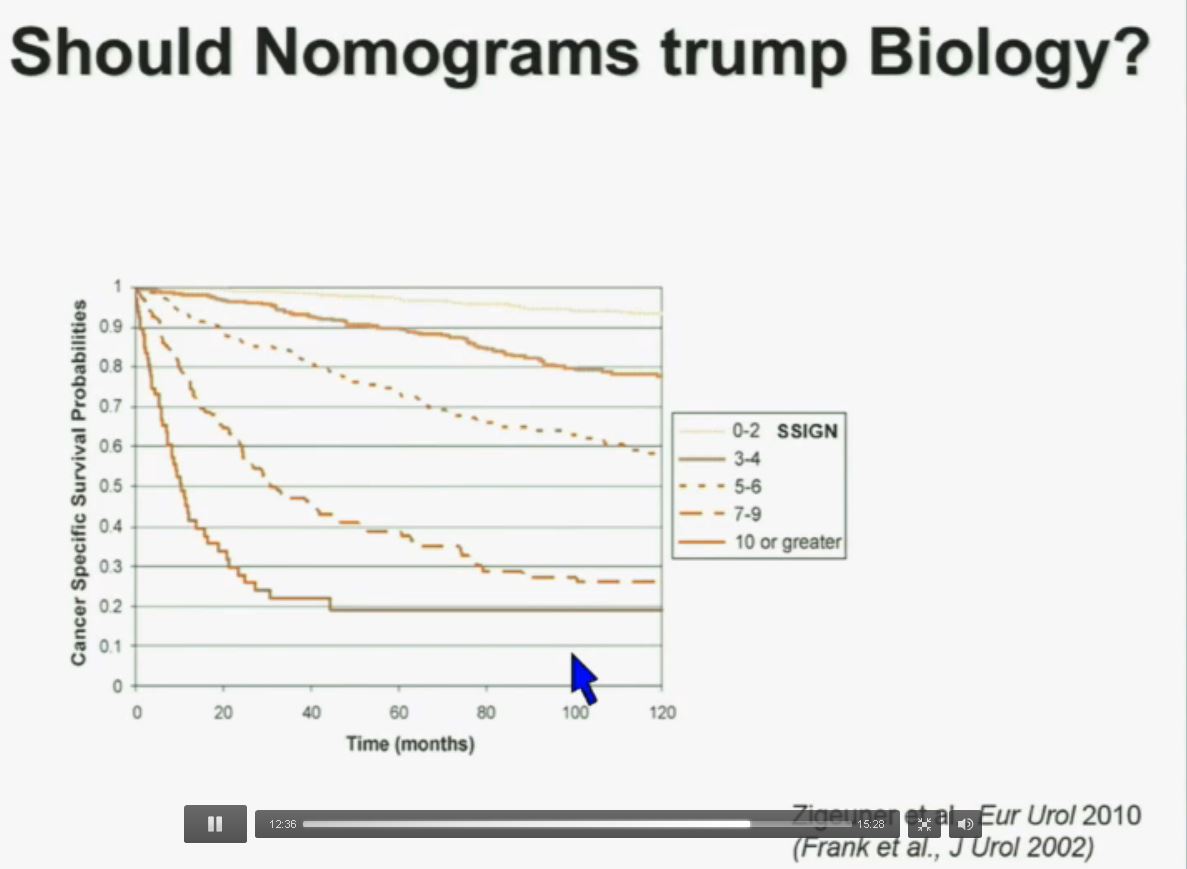
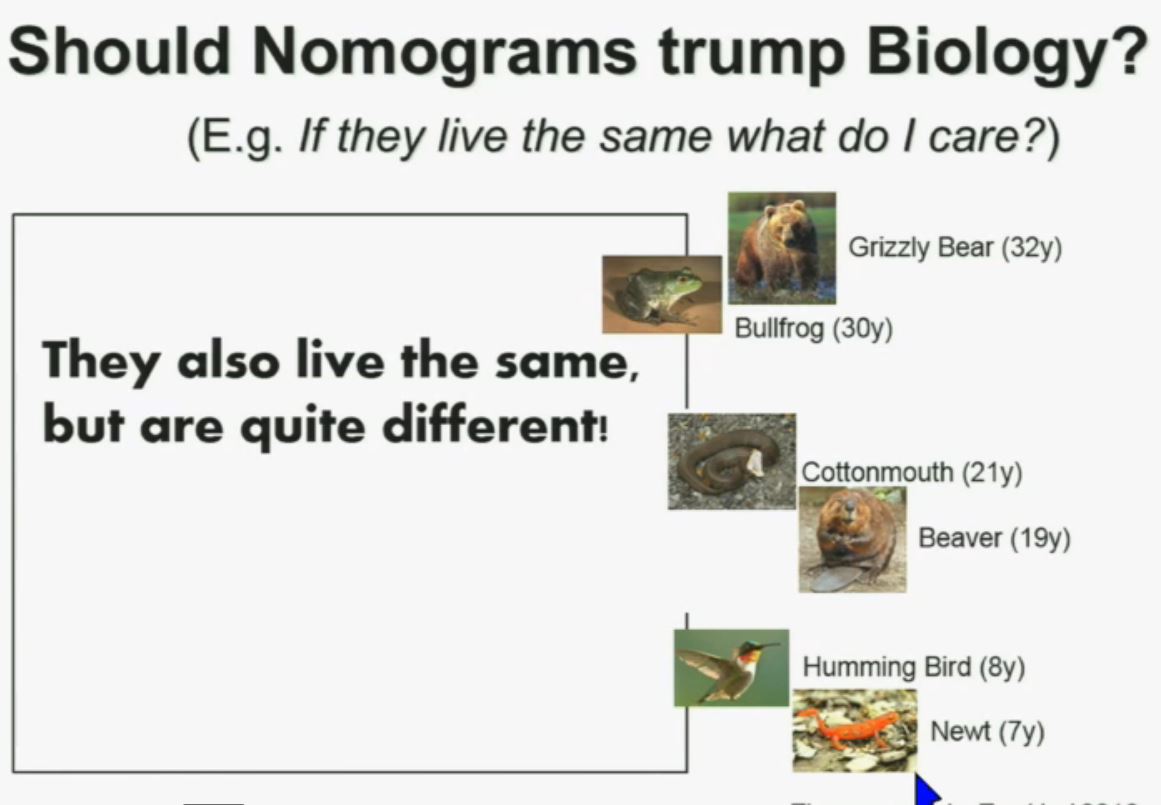
Now another question I submit to you. Should nomograms trump biology? In other words, if they live the same, “What do I care?” That has been the traditionally the thinking in the clinic. But look at these animals. A bullfrog and a grizzly bear also live about 30 years. However, they’re very different. The same is true for cottonmouth, a beaver or hummingbird or a newt. So even though they live the same, they are actually quite different!
We should be probing deeper and in fact, they should be dealt with differently!
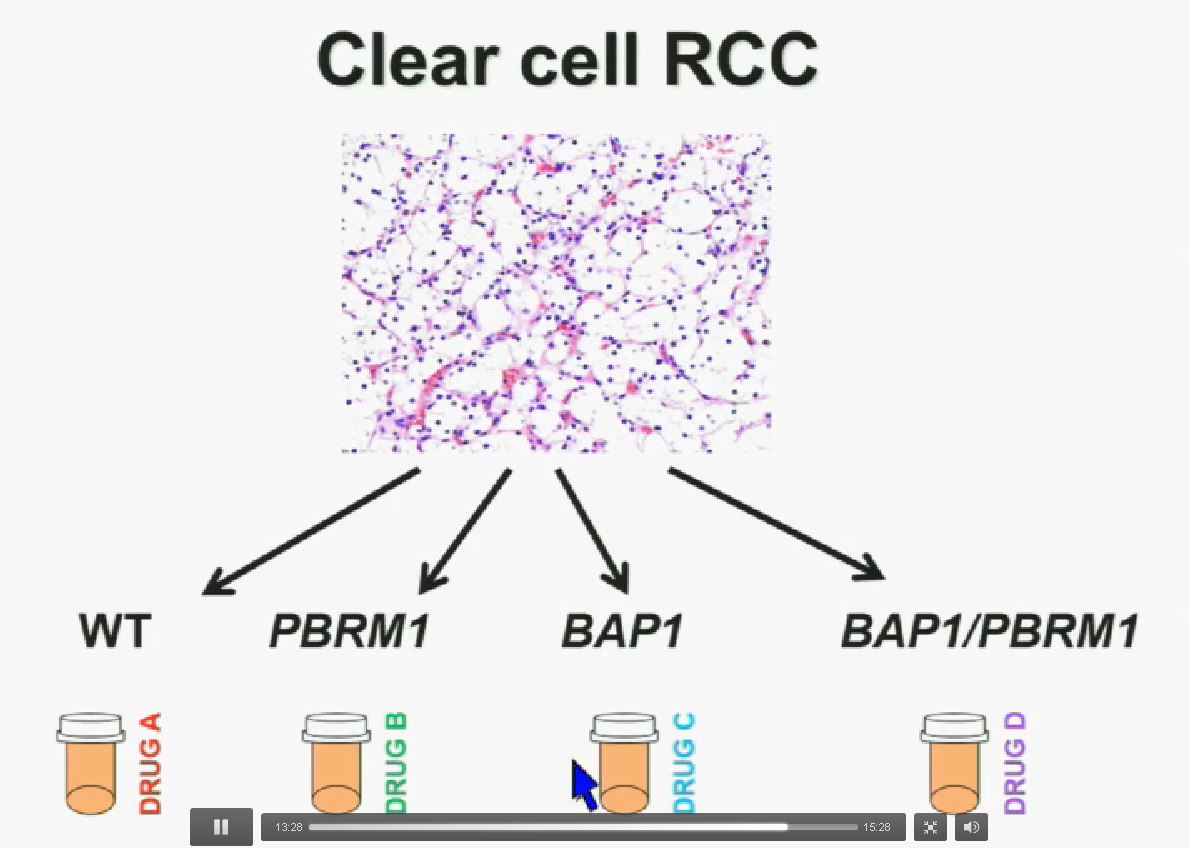
I believe that clear-cell renal cell carcinomas are in fact divided for at least four different subtypes. There are tumors that are wild type for both BAP1 and PBRM1, tumors that are PBRM1 deficient, tumors that are BAP1 deficient, and tumors that are deficient for both. In the future we are going to see different treatments for different tumor types.
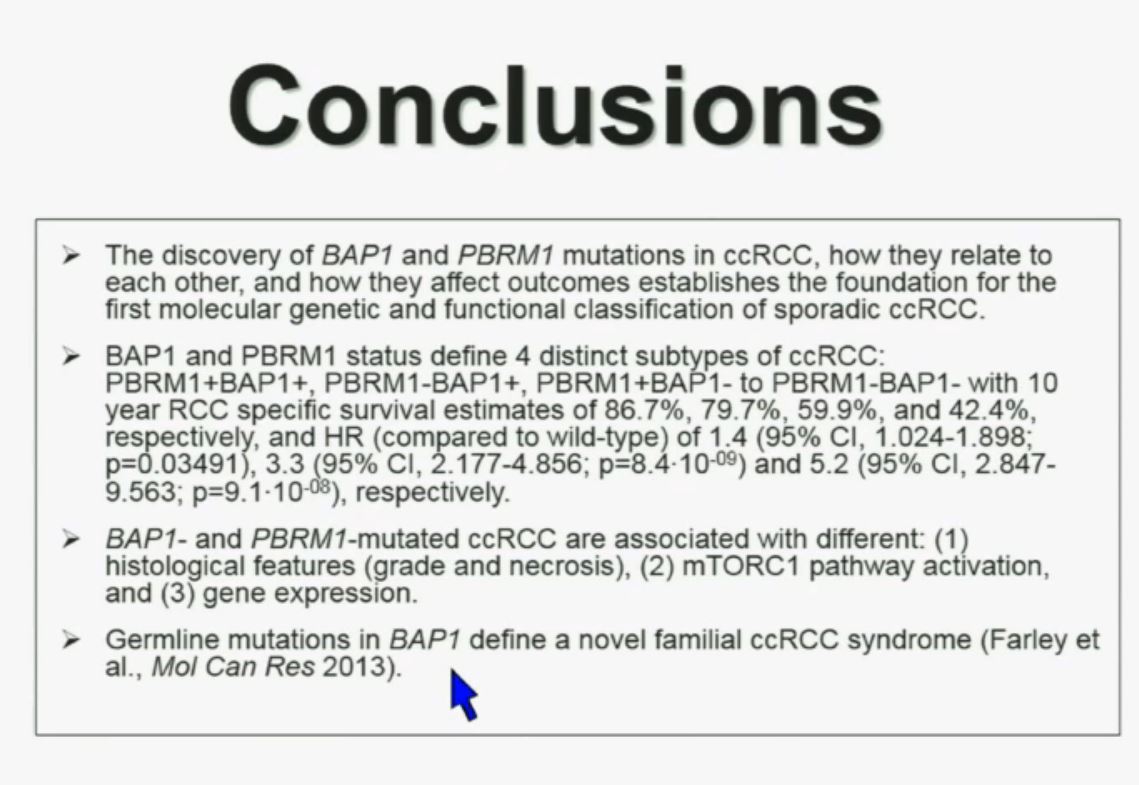
In conclusion, the discovery of BAP1 and PBRM1 mutations in clear cell renal cell carcinoma, how they relate to each other, and how they affect outcomes establishes the foundation for the first molecular and functional classification of sporadic ccRCC.
These two genes define for distinct subtypes, which I just went over and you have the Hazard Ratios and p-values written down there. These two tumors are not only associated with different outcomes, but they are also associated with different activations on the mTOR1 pathway and gene expression. Finally we identify mutations in BAP1 which define a novel clear-cell renal cell carcinoma syndrome. I have forty seconds left!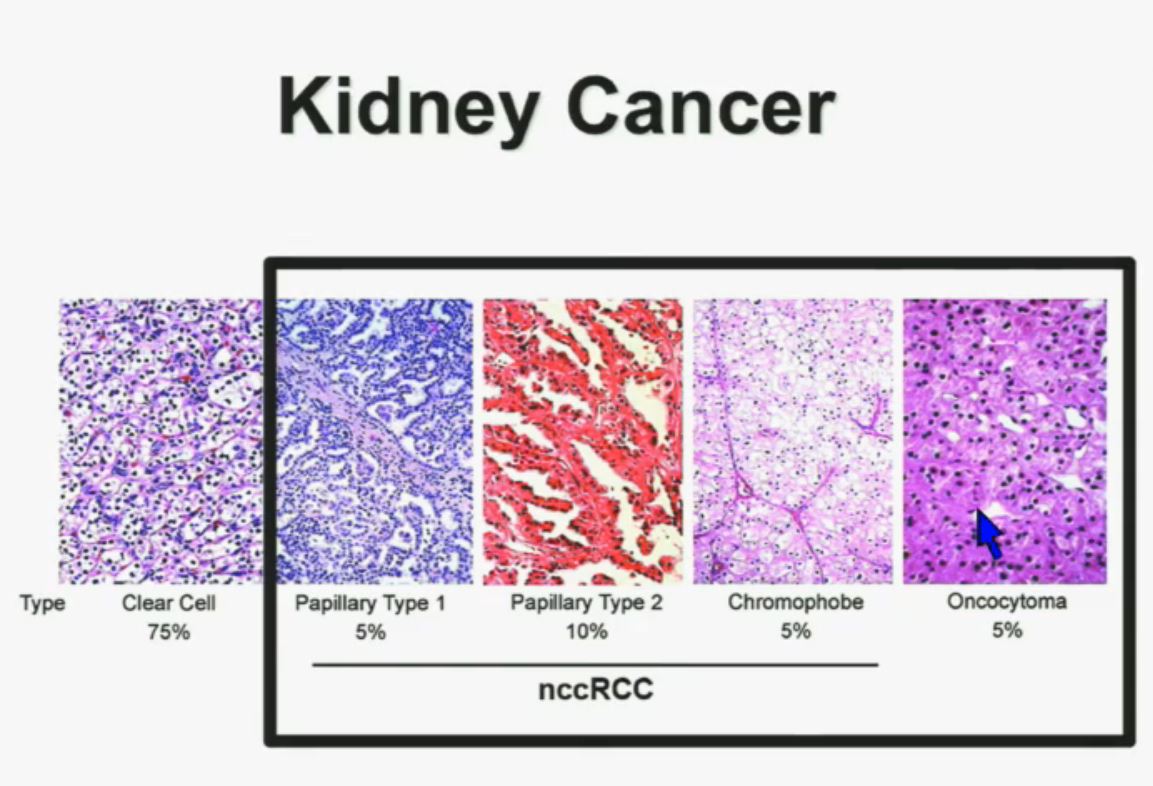
I will go through these very quickly. Suffice it to say, we have also done molecular genetic analysis in non-clear-cell renal cell carcinoma, papillary, chromophobe, oncocytomas, This is now in press in Nature Genetics.
We found that papillary clear-cell carcinoma have more mutations than clear cell carcinoma, whereas chromophobe and oncocytomas have significantly lower mutation burdens, which is depicted there.
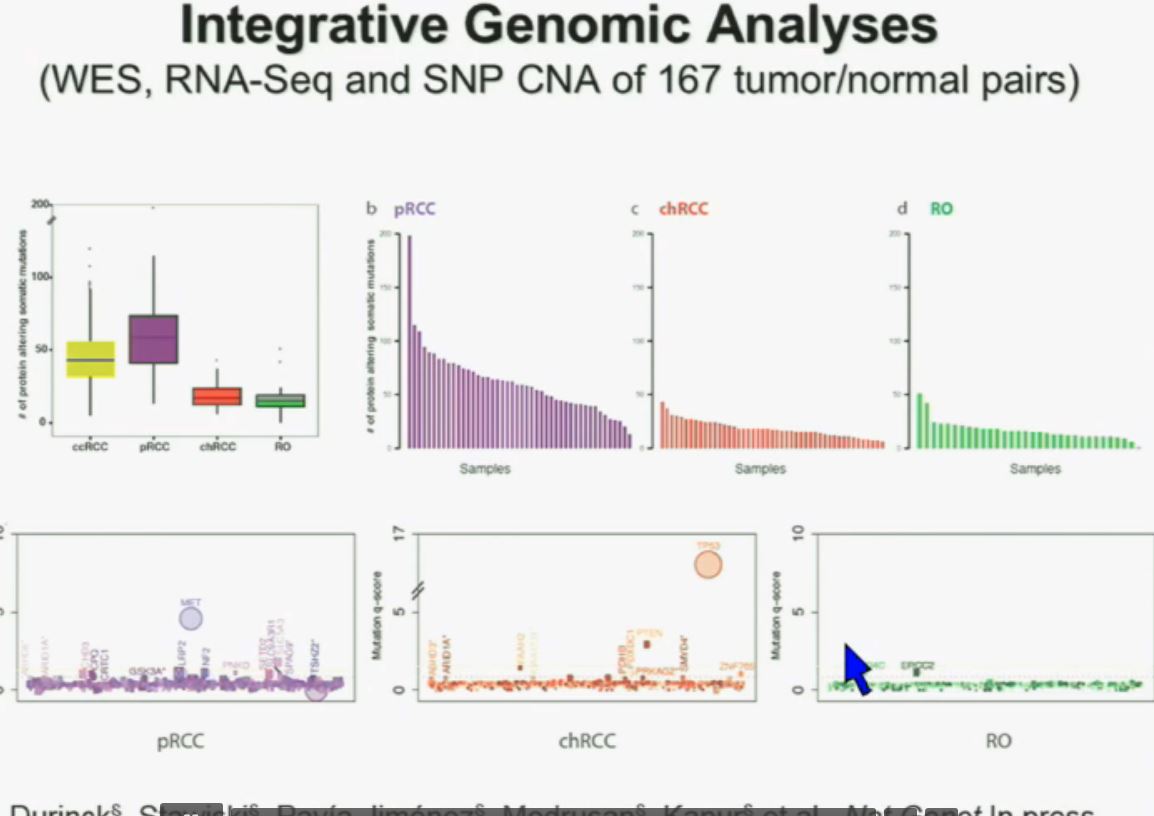
These are some genes we found overrepresented– five seconds! You can see the copy number alterations, gene expressions. Anyway, these papers will be coming out next week.
Finally, to acknowledge people who did the work in my laboratory, Pena-Llopis. We have had a close collaboration with the people at Mayo Clinic, and also the group at Genentech. We also work very closely with our surgeon and Payal Kapur, our pathologist.


 QED
QED